Fig. 7.
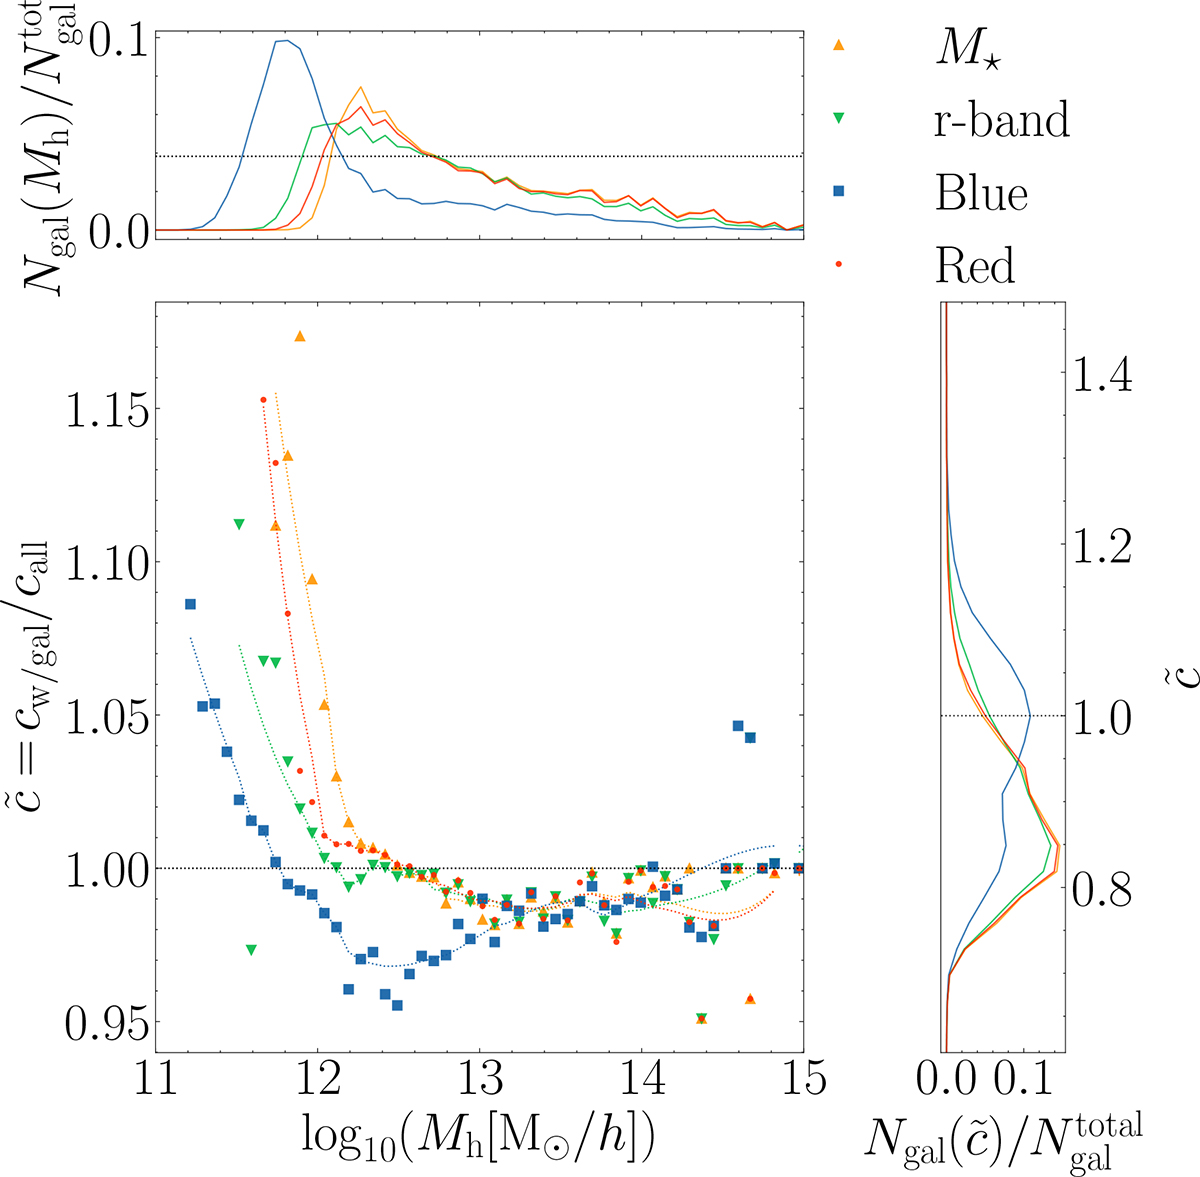
Download original image
Ratio of the median concentration of the halos hosting the stellar mass, r-band, blue and red galaxy samples with n = 0.003 h3 Mpc−3 at z = 0 to that of all halos at z = 0. The results for the stellar mass, r-band, blue and red galaxy samples are shown in orange, green, blue and red, respectively. The upper panel shows a histogram with the number of galaxies as a function of halo mass, while the right panel shows the median concentration of halos hosting different galaxy populations and all halos.
Current usage metrics show cumulative count of Article Views (full-text article views including HTML views, PDF and ePub downloads, according to the available data) and Abstracts Views on Vision4Press platform.
Data correspond to usage on the plateform after 2015. The current usage metrics is available 48-96 hours after online publication and is updated daily on week days.
Initial download of the metrics may take a while.