Fig. 8.
Download original image
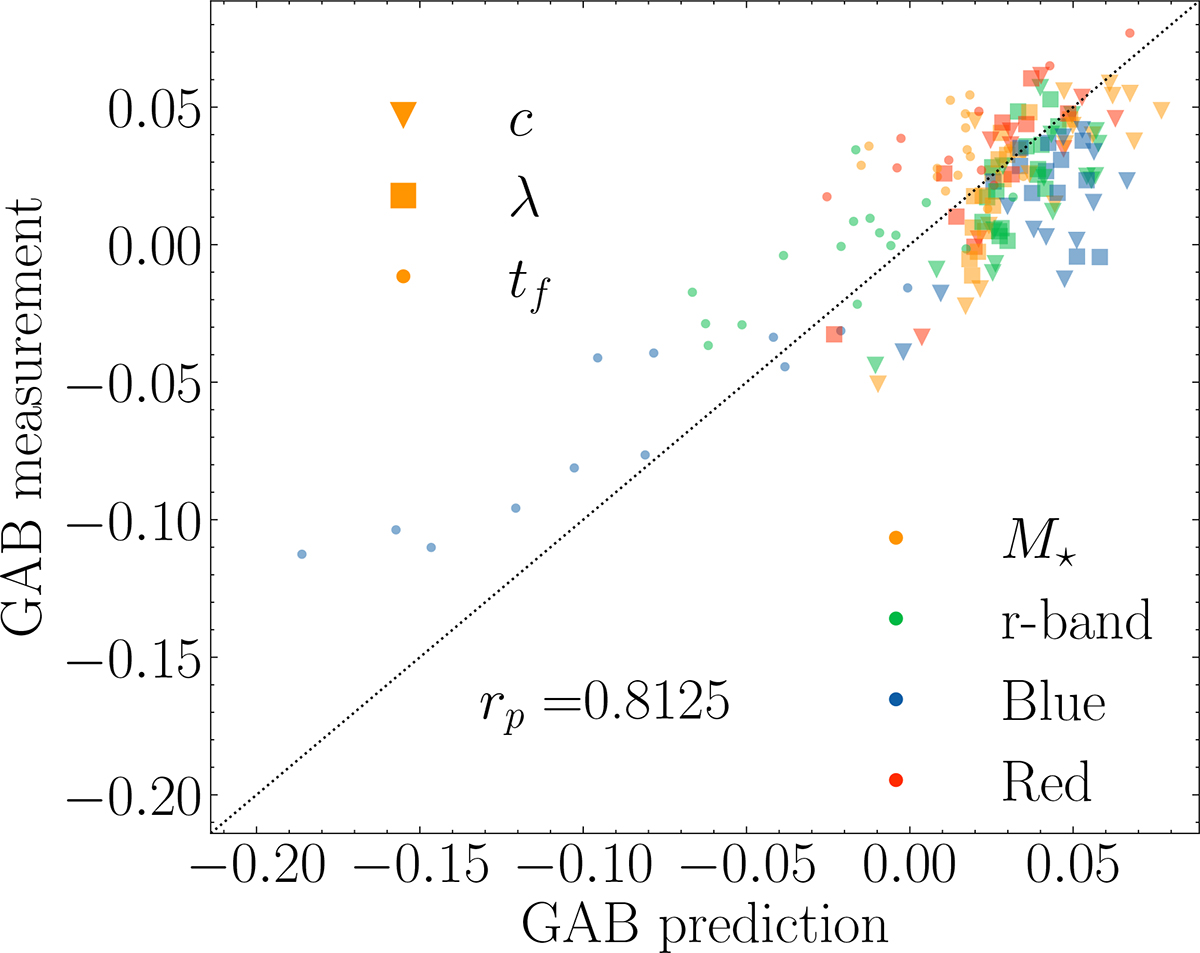
Comparison between direct measurements of galaxy assembly bias from the shuffling procedure and predictions from our analytic model. The results for the stellar mass, r-band, blue, and red samples are shown in orange, green, blue and red, respectively, while the triangles, squares and dots indicate the galaxy assembly bias due to concentration, spin, and formation time. The dotted line indicates a 1 : 1 relation between measurements and predictions. We note that our analytic expression accurately predicts the amount of galaxy assembly bias resulting from the three studied halo properties, with a Pearson correlation greater than r = 0.8.
Current usage metrics show cumulative count of Article Views (full-text article views including HTML views, PDF and ePub downloads, according to the available data) and Abstracts Views on Vision4Press platform.
Data correspond to usage on the plateform after 2015. The current usage metrics is available 48-96 hours after online publication and is updated daily on week days.
Initial download of the metrics may take a while.