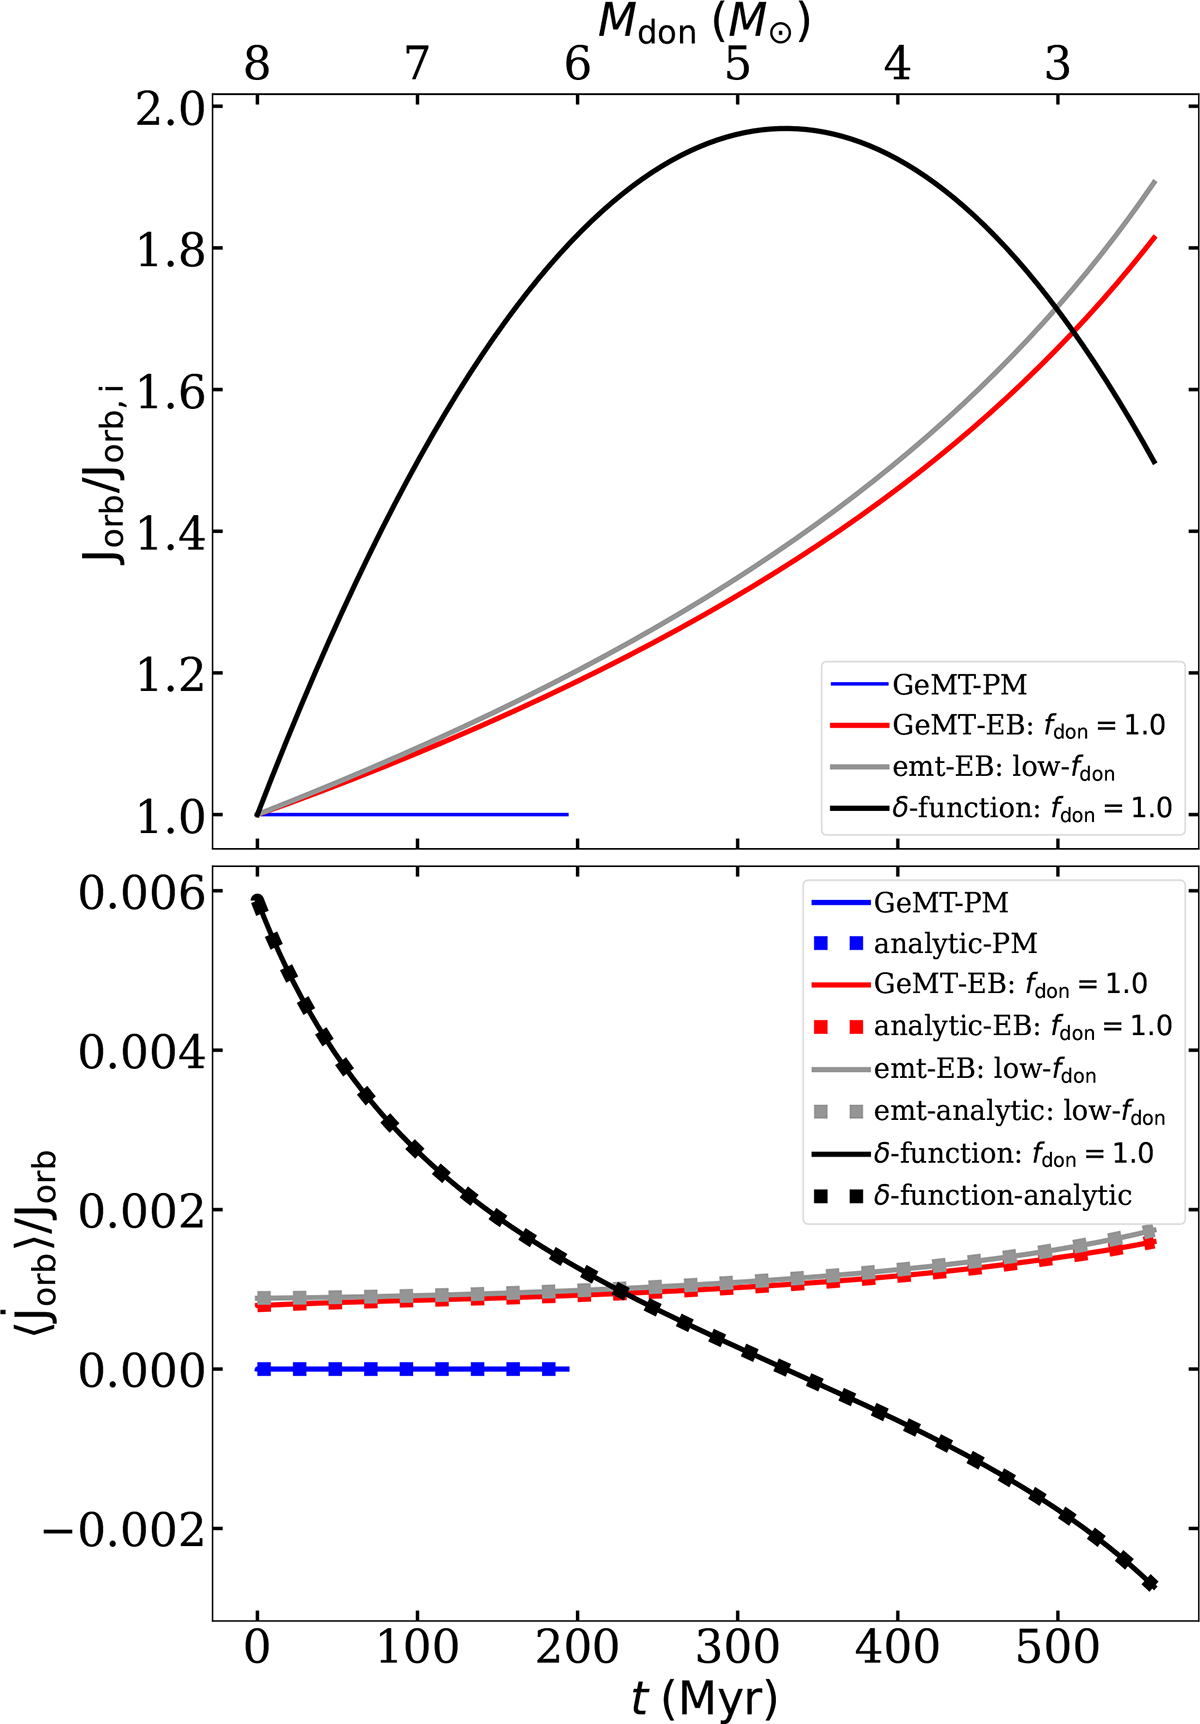
Fig. 11.
Download original image
Evolution of the orbital angular momentum (top) and its change rate (bottom) for the examples presented in Fig. 7. The blue and red lines correspond to the GeMT model for point masses and extended bodies, respectively. The black and gray lines correspond to the δ-function and emt models, respectively. The solid lines illustrate the numerical solutions, and the squares show the analytical expectations.
Current usage metrics show cumulative count of Article Views (full-text article views including HTML views, PDF and ePub downloads, according to the available data) and Abstracts Views on Vision4Press platform.
Data correspond to usage on the plateform after 2015. The current usage metrics is available 48-96 hours after online publication and is updated daily on week days.
Initial download of the metrics may take a while.