Fig. 12.
Download original image
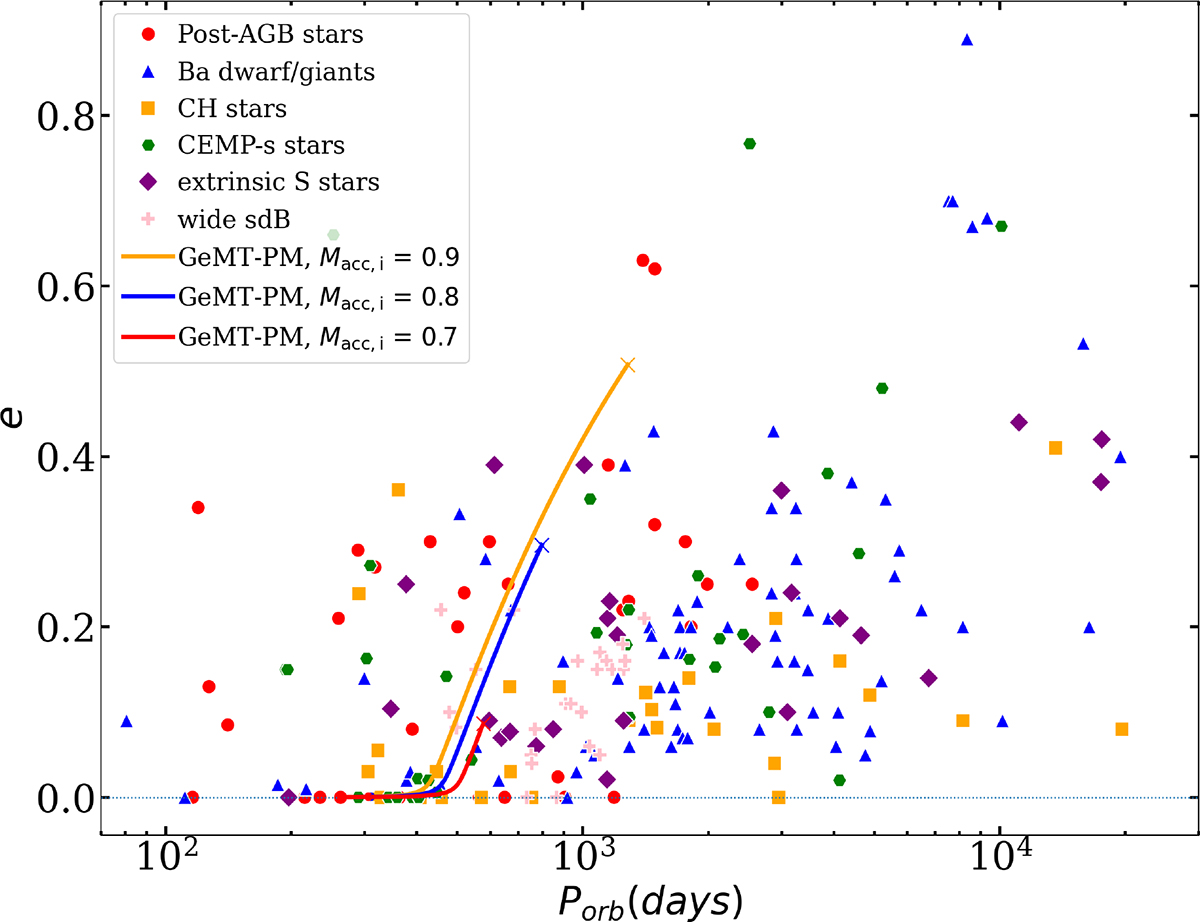
Evolution of the system presented in Fig. 7 in the Porb − e plane. The orange, blue, and red lines correspond to the GeMT model for subsynchronous (fdon = 0.0), synchronous (fdon = 1.0), and supersynchronous donors (fdon = 2.0), respectively. The small circles and crosses indicate the initial and final positions of the systems, respectively. The red circles represent the post-AGB stars (Oomen et al. 2018). The blue triangles represent the Ba dwarfs and giants (Jorissen et al. 2019; Escorza et al. 2019, 2020), orange squares show CH subgiants (Escorza et al. 2019, 2020), green pentagons show CEMP-s stars (Hansen et al. 2016; Jorissen et al. 2016; Sperauskas et al. 2016), purple diamonds show extrinsic S stars (Fekel et al. 2000; Jorissen et al. 2019; Escorza et al. 2020), and pink plusses show wide sdB binaries (Deca et al. 2012; Barlow et al. 2012; Vos et al. 2012, 2013, 2017; Vos et al. 2019; Dorsch et al. 2021; Molina et al. 2022).
Current usage metrics show cumulative count of Article Views (full-text article views including HTML views, PDF and ePub downloads, according to the available data) and Abstracts Views on Vision4Press platform.
Data correspond to usage on the plateform after 2015. The current usage metrics is available 48-96 hours after online publication and is updated daily on week days.
Initial download of the metrics may take a while.