Fig. 7.
Download original image
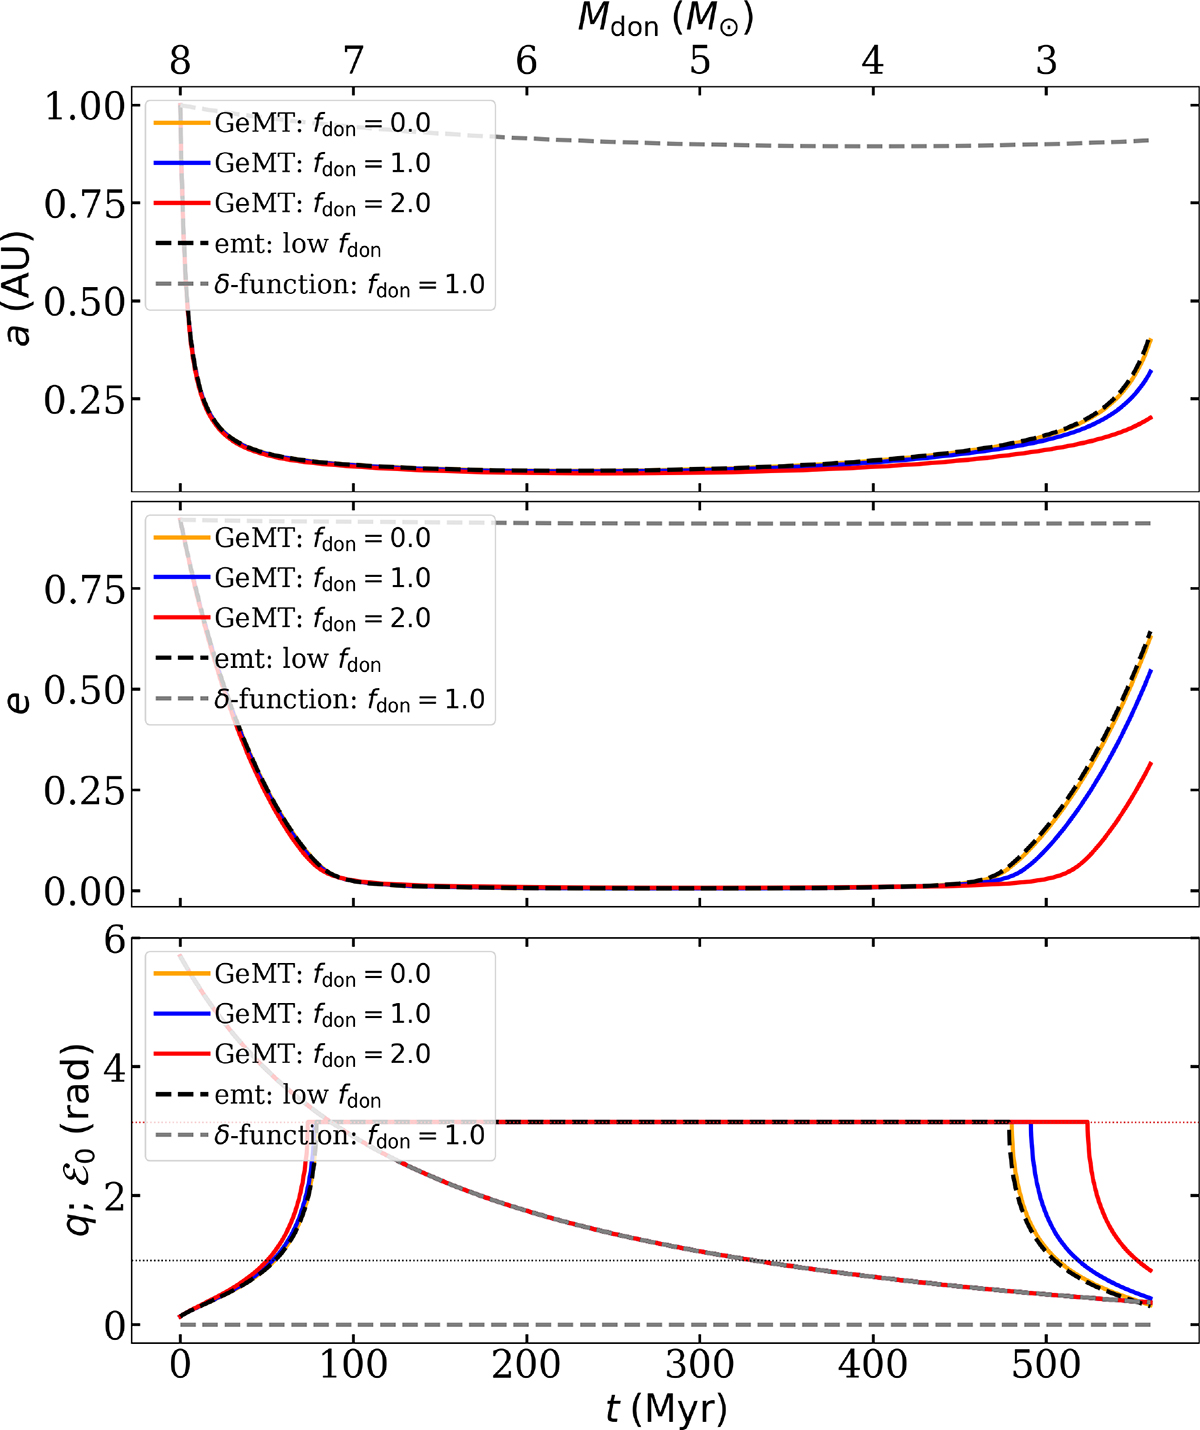
Evolution of the semimajor axis (top), eccentricity (middle), mass ratio q, and angle ℰ (bottom) as a function of time during mass transfer. The dashed black and gray lines correspond to the emt and δ-function (fdon = 1.0) models, respectively. The orange, blue and red lines correspond to the GeMT model, for subsynchronous (fdon = 0.0), synchronous (fdon = 1.0) and supersynchronous donors (fdon = 2.0), respectively. In the bottom panel, the two horizontal dotted lines indicate ℰ0 = π and q = 1.
Current usage metrics show cumulative count of Article Views (full-text article views including HTML views, PDF and ePub downloads, according to the available data) and Abstracts Views on Vision4Press platform.
Data correspond to usage on the plateform after 2015. The current usage metrics is available 48-96 hours after online publication and is updated daily on week days.
Initial download of the metrics may take a while.