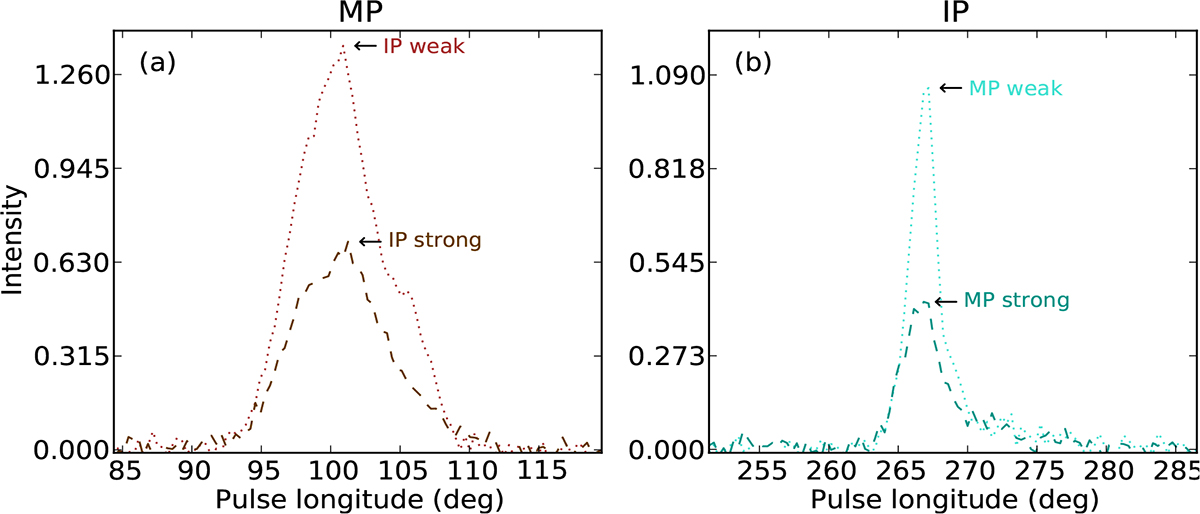
Fig. 12.
Download original image
Average profiles of MP and IP of PSR J1926+0737 based on grouping pulses by the brightest and weakest halves of the opposite pulse. Panel a: MP profiles based on, from top to bottom: weakest IP in running averaged (dark red), then brightest IP in running averaged (brown) marked in Fig. 11b. Panel b: IP average pulse profiles, based on the MP halves, with colours in cyan and green, as marked in Fig. 11a. An anti-correlation is clearly present.
Current usage metrics show cumulative count of Article Views (full-text article views including HTML views, PDF and ePub downloads, according to the available data) and Abstracts Views on Vision4Press platform.
Data correspond to usage on the plateform after 2015. The current usage metrics is available 48-96 hours after online publication and is updated daily on week days.
Initial download of the metrics may take a while.