Fig. 14.
Download original image
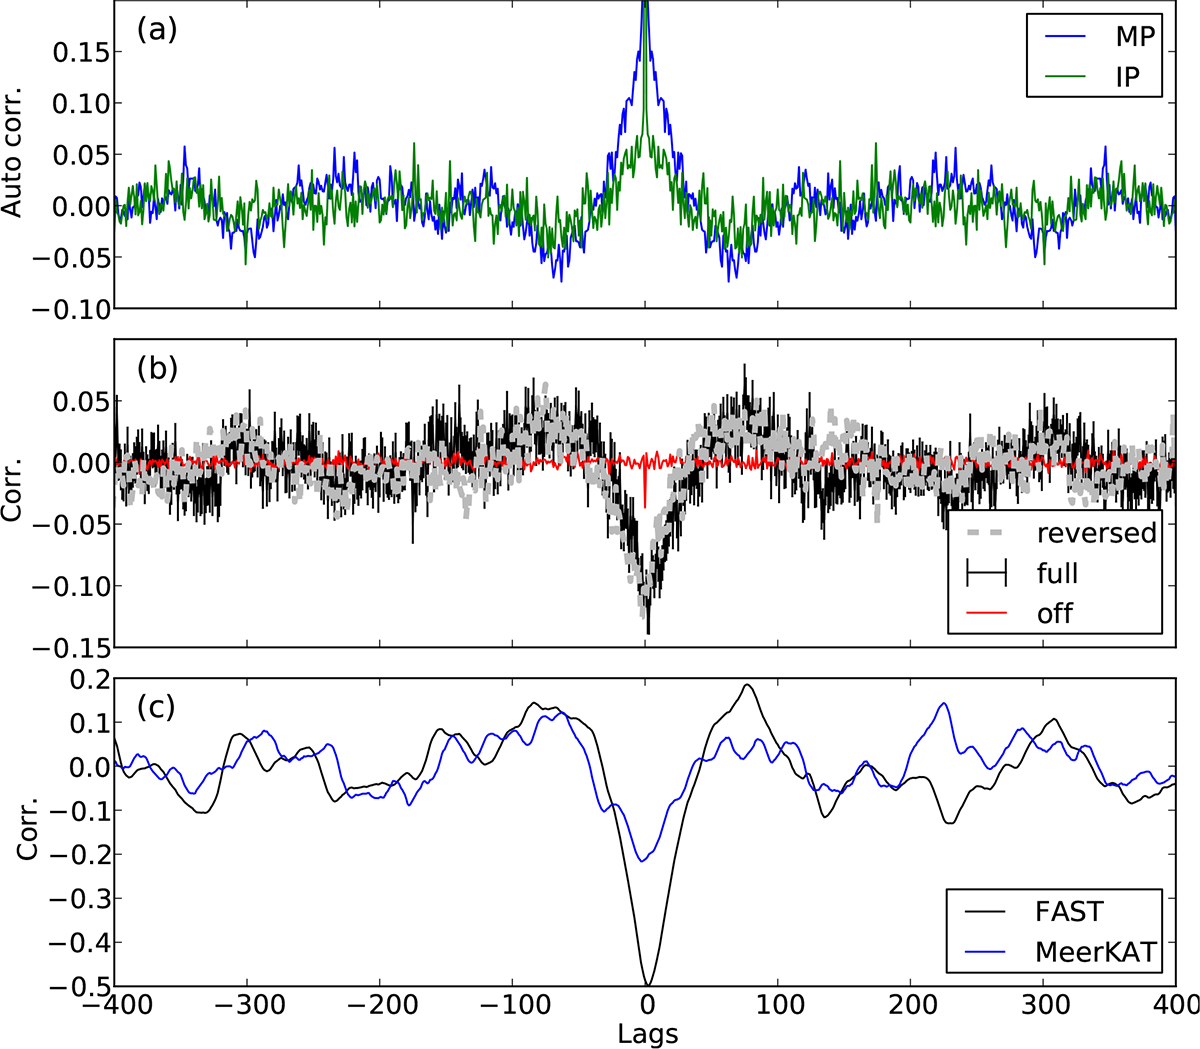
Correlation plots of PSR J1926+0737. Panel a: Auto-correlation curves of the MP and the IP intensities, which reveal any periodicities in the pulse intensities. The plots are zoomed-in to the y-range of −0.1 to 0.2. Panel b: Cross-correlation between the MP and the IP single-pulse intensities and its error bars in black line, and the correlation when reversing the order of the single pulses in grey dashed line. The corresponding correlation of the off-pulse regions is in red. Panel c: Correlation plots computed using the running averaged intensities of the MP and the IP, with the Fast full sequence in black, and the MeerKAT full sequence in blue, respectively.
Current usage metrics show cumulative count of Article Views (full-text article views including HTML views, PDF and ePub downloads, according to the available data) and Abstracts Views on Vision4Press platform.
Data correspond to usage on the plateform after 2015. The current usage metrics is available 48-96 hours after online publication and is updated daily on week days.
Initial download of the metrics may take a while.