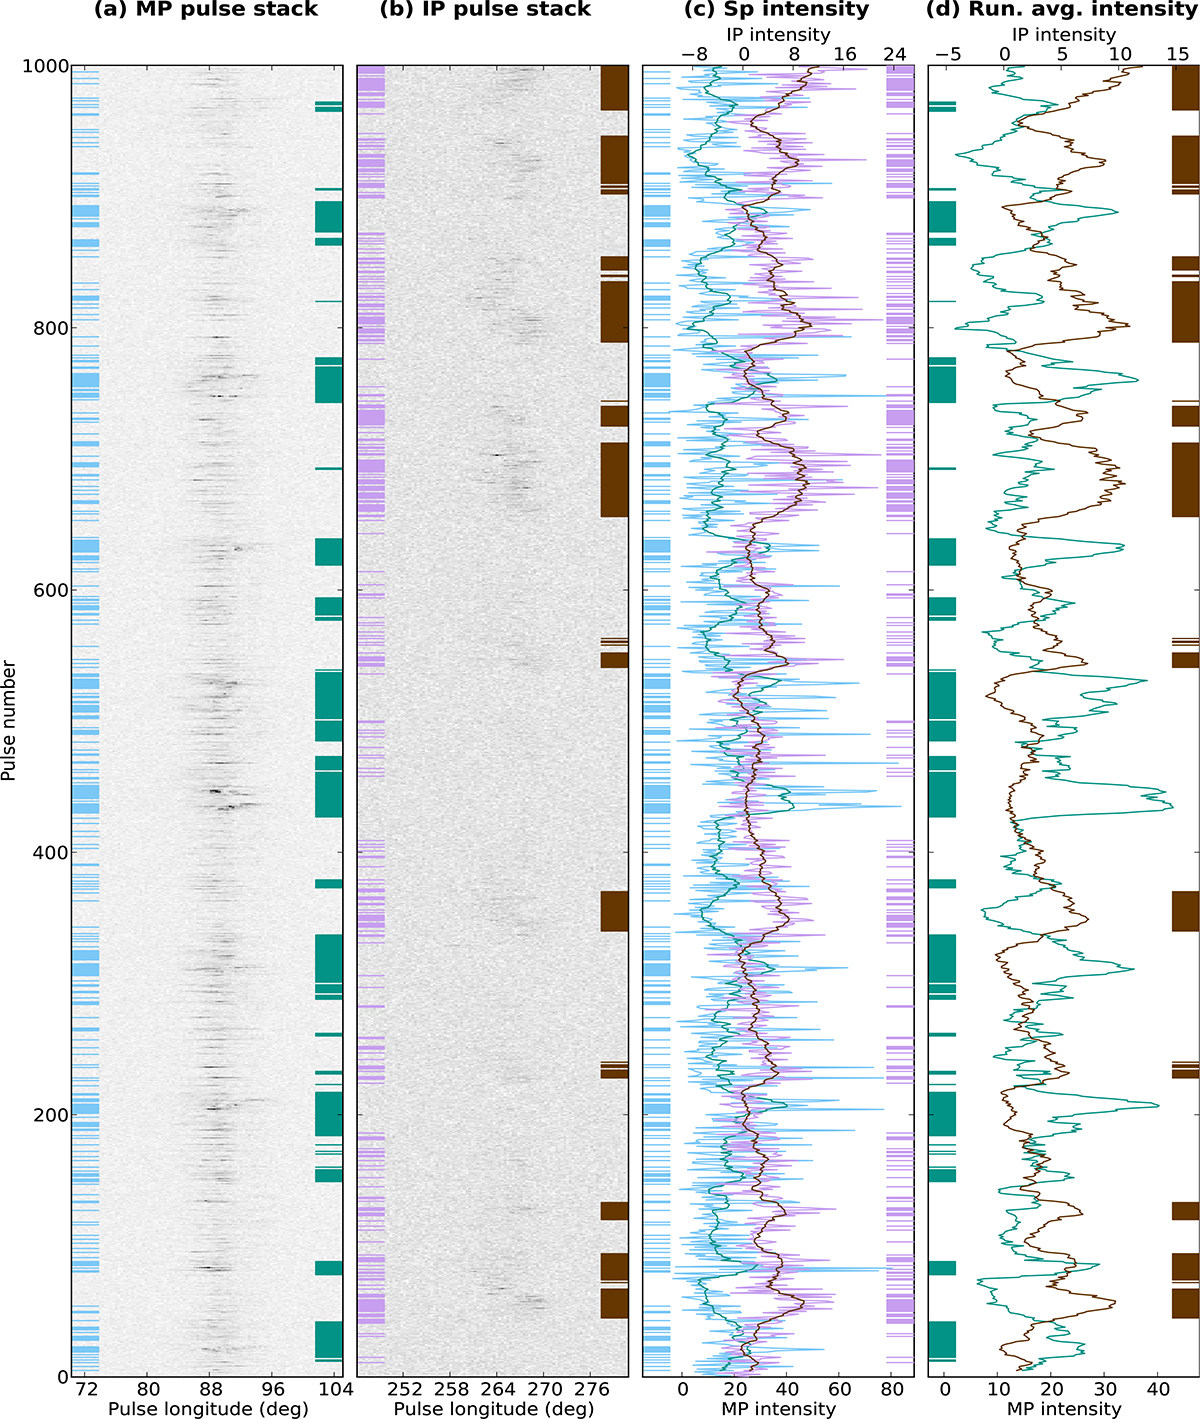
Fig. 3.
Download original image
First 1000 single pulses for PSR J1842+0358. Pulse stacks (MP, IP) and intensities (single-pulse, running-averaged). Panel a: Pulse stack of the MP. The blue and green margin bars mark the bright pulses, based on the intensities of the single pulses (blue, left) or their running averages (green, right). Panel b: Same as (a) but for the IP, now with violet and brown for single-pulse or running-averaged intensities, respectively. Panel c: Single-pulse intensities of the MP and the IP, with the running averaged intensities plotted on top. Margin bars are identical to the left of (a) and (b). Panel d: Running averaged intensities of the MP and the IP plotted alone, along with the corresponding selected bars (the same as those on the right of a and b). The rest of the PSR J1842+0358 pulse stacks are available online.
Current usage metrics show cumulative count of Article Views (full-text article views including HTML views, PDF and ePub downloads, according to the available data) and Abstracts Views on Vision4Press platform.
Data correspond to usage on the plateform after 2015. The current usage metrics is available 48-96 hours after online publication and is updated daily on week days.
Initial download of the metrics may take a while.