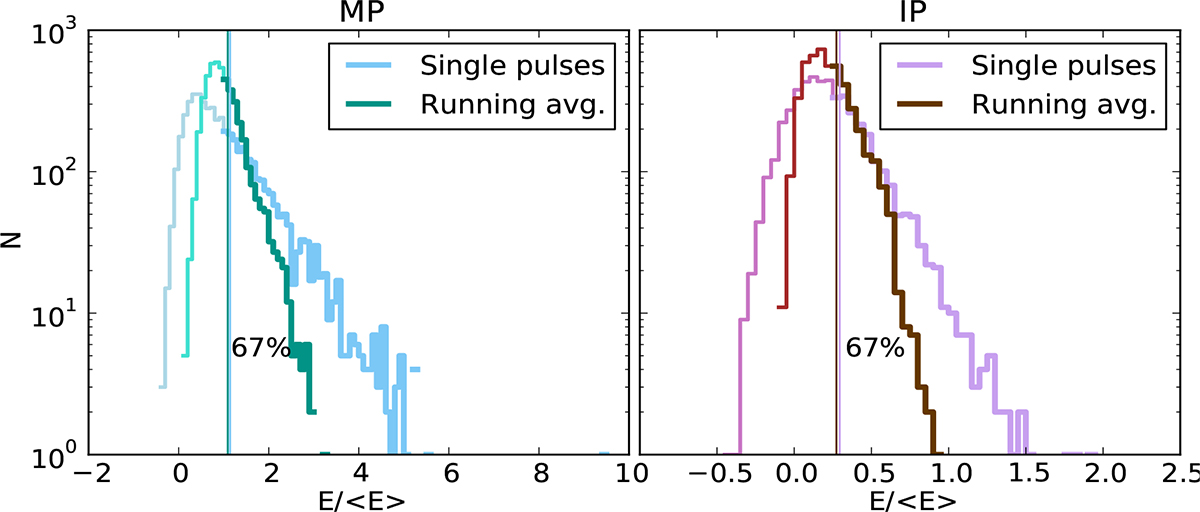
Fig. 4.
Download original image
Pulse energy distributions of PSR J1842+0358 for MP (left) and IP (right), with single-pulse energies (blue and violet) and running-averaged pulse energies (green and brown). The same colours of the pulse energies corresponding to the bright groups as in Fig. 3 apply. The weak pulse energy distributions use the same but lighter set of colours. The two pulse energies are normalised by the mean MP energy. The vertical line indicates the cut of the two groups, of 1/3 bright and 2/3 weak pulse intensities (as described in Sect. 3.4.1).
Current usage metrics show cumulative count of Article Views (full-text article views including HTML views, PDF and ePub downloads, according to the available data) and Abstracts Views on Vision4Press platform.
Data correspond to usage on the plateform after 2015. The current usage metrics is available 48-96 hours after online publication and is updated daily on week days.
Initial download of the metrics may take a while.