Fig. 6.
Download original image
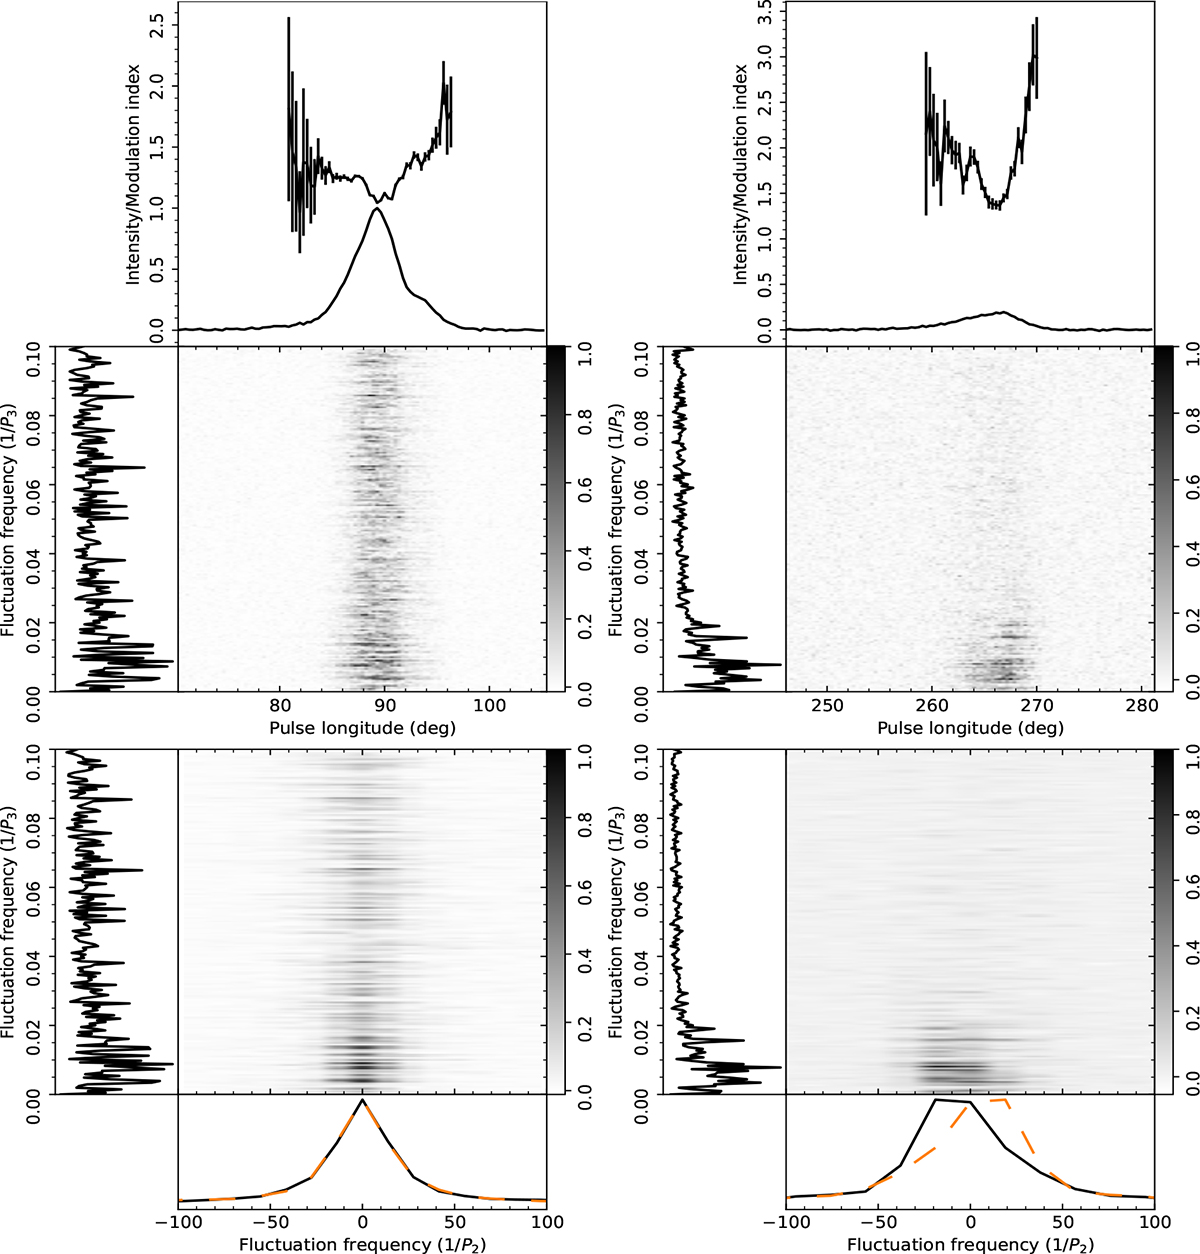
Fluctuation spectra of PSR J1842+0358 for MP (left) and IP (right). Top: Average pulse profile and the modulation index (black dots with error bars) against pulse longitude. Middle: LRFS as fluctuation frequency (1/P3, in cycles per period, cpp). Its side panel shows the integrated power. Bottom: 2DFS, with fluctuation frequencies on both axes in cpp, with 1/P3 vs. 1/P2. Its left and bottom subpanels show the horizontal and vertical integrated power. The orange curve is the horizontal mirror image of the black curve in the bottom panel, indicating whether there are any possible drift in the pulse stack. The greyscale bars indicates the scale. Values above 1 are clipped.
Current usage metrics show cumulative count of Article Views (full-text article views including HTML views, PDF and ePub downloads, according to the available data) and Abstracts Views on Vision4Press platform.
Data correspond to usage on the plateform after 2015. The current usage metrics is available 48-96 hours after online publication and is updated daily on week days.
Initial download of the metrics may take a while.