Open Access
Fig. 9.
Download original image
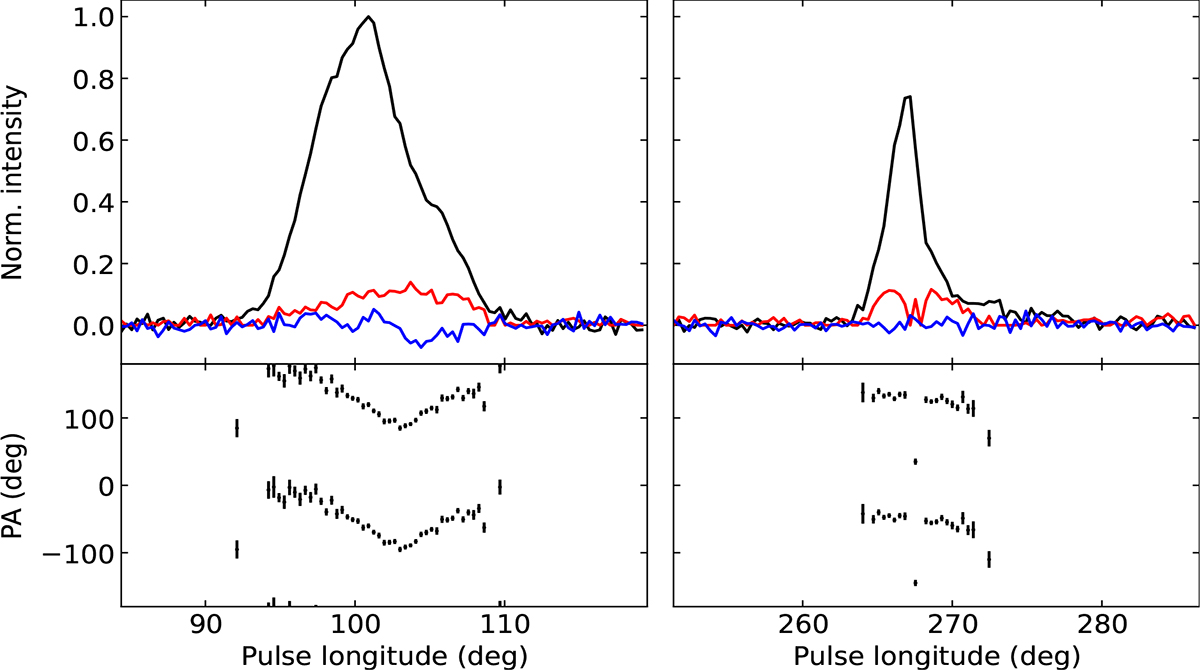
Average pulse profile of PSR J1926+0737 (top) for MP (left) and IP (right). The total intensity profile (normalised by the MP peak) is in black, and the corresponding linear and circular polarisation are shown in red and blue, respectively. The bottom plots show the computed polarisation position angles.
Current usage metrics show cumulative count of Article Views (full-text article views including HTML views, PDF and ePub downloads, according to the available data) and Abstracts Views on Vision4Press platform.
Data correspond to usage on the plateform after 2015. The current usage metrics is available 48-96 hours after online publication and is updated daily on week days.
Initial download of the metrics may take a while.