Open Access
Fig. 12.
Download original image
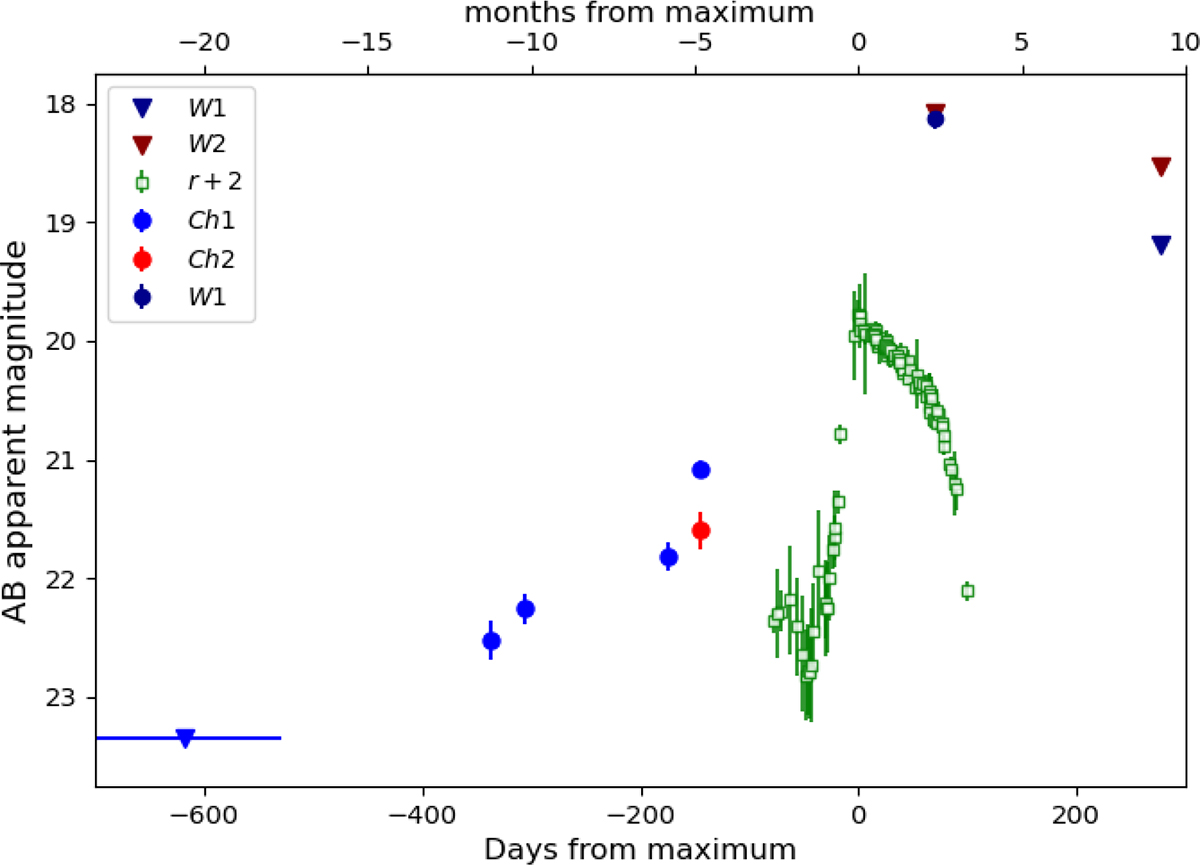
Mid-infrared light curve of AT 2020hat before (from SST) and during (from WISE) the outburst. Downwards triangles mark upper limits. For reference, the r-band light curve from Pastorello et al. (2021b) is also shown with green squares.
Current usage metrics show cumulative count of Article Views (full-text article views including HTML views, PDF and ePub downloads, according to the available data) and Abstracts Views on Vision4Press platform.
Data correspond to usage on the plateform after 2015. The current usage metrics is available 48-96 hours after online publication and is updated daily on week days.
Initial download of the metrics may take a while.