| Issue |
A&A
Volume 706, February 2026
|
|
|---|---|---|
| Article Number | A154 | |
| Number of page(s) | 17 | |
| Section | Stellar structure and evolution | |
| DOI | https://doi.org/10.1051/0004-6361/202555226 | |
| Published online | 06 February 2026 | |
The fate of the progenitors of luminous red novae: Infrared detection of LRNe years after the outburst
1
INAF – Osservatorio Astronomico di Padova Vicolo dell’Osservatorio 5 I-35122 Padova, Italy
2
INAF – Osservatorio Astronomico di Brera Via E. Bianchi 46 I-23807 Merate (LC), Italy
★ Corresponding author: This email address is being protected from spambots. You need JavaScript enabled to view it.
Received:
20
April
2025
Accepted:
16
November
2025
Abstract
We present late-time optical and infrared (IR) observations of a sample of nine extragalactic luminous red novae (LRNe) discovered in the past three decades. In all of these cases, the LRN survivors fade below the pre-outburst luminosity of the progenitors in the optical region. However, they remain visible in the near-IR (NIR) and bright in the mid-IR (MIR) domains for years. We recover AT 1997bs in Spitzer images from 2004, and a residual source is visible in HST and JWST NIR images 27 years after the outburst. The spectral energy distribution (SED) of AT 1997bs is consistent with that of an orange giant star with a photospheric temperature of 3750–4250 K and a radius of 120–150 R⊙, without a significant circumstellar dust attenuation. Similarly, the SED of AT 2019zhd after three years is compatible with a red supergiant star with Tph ∼ 3100 ± 100 K and R ∼ 350 ± 50 R⊙. Another LRN, AT 2011kp, is detected by JWST 12.5 years after the outburst. Its SED, with two excesses at 1.8 and 7.7 μm, can be explained by a cold (T ∼ 450 K) dusty shell composed of amorphous carbon surrounding a cold expanded source, plus emission from the Paα line. We constructed the [3.6]−[4.5] colour curves extending up to more than 7 years for six LRNe, which show a similar evolution: The MIR colour is ∼ − 0.5 mag before the optical maximum light, it becomes bluer after around one year, and then it gradually turns to redder colours in the following years before reaching [3.6]−[4.5]∼ + 1.0 mag 7 years after the outburst. We also estimated the masses and the temperatures of newly formed dust years after the LRN onset. We find that LRNe produce dust masses of the order of (1–5) × 10−4 (and up to 2 × 10⁻³) M⊙ between 7 and 13 years after the outbursts. Finally, we find that the remnants of LRNe detected years or decades after the merger tend to be expanded and cool objects, similar to red supergiant stars.
Key words: techniques: photometric / binaries: close / binaries: general / supernovae: general / dust / extinction
© The Authors 2026
 Open Access article, published by EDP Sciences, under the terms of the Creative Commons Attribution License (https://creativecommons.org/licenses/by/4.0), which permits unrestricted use, distribution, and reproduction in any medium, provided the original work is properly cited.
This article is published in open access under the Subscribe to Open model. This email address is being protected from spambots. You need JavaScript enabled to view it. to support open access publication.
1. Introduction
In recent years, a growing number of transients have been discovered that have absolute magnitudes at maximum between those of the most luminous novae and the faintest supernovae (SNe), i.e. in the interval −15 ≲ MV ≲ −10 mag. Objects within this range of brightness are usually called ‘intermediate luminosity optical transients’ (Berger et al. 2009). However, to avoid confusion with other classes with a similar name, we refer to them as ‘interacting gap transients’ (IGTs; Pastorello & Fraser 2019; Cai et al. 2022a). This family comprises a wide range of astrophysical events, including (but not limited to) erratic outbursts of supergiant stars; giant eruptions of luminous blue variables (LBVs; Humphreys & Davidson 1994); electron-capture SN candidates, sometimes labelled intermediate-luminosity red transients (ILRTs; Botticella et al. 2009; Cai et al. 2021); and stellar mergers. Some of the above IGT species share observational similarity with true type IIn SNe without being terminal explosions. For this reason, they are collectively named SN impostors (Van Dyk et al. 2000; Maund et al. 2006).
Among the IGTs, in this paper we focus on luminous red novae (LRNe; Kulkarni et al. 2007), which are thought to be the visible outcome of the coalescence of two non-degenerate stars, which occurs after the ejection of a common envelope (e.g., Tylenda et al. 2011; Ivanova et al. 2013b; Kochanek et al. 2014; Pejcha 2014; Howitt et al. 2020; MacLeod et al. 2022; Ivanova et al. 2013a; Chen & Ivanova 2024). Numerous 3D simulations have been conducted to study the common envelope ejection dynamics (Nandez et al. 2014; Ivanova & Nandez 2016; Ohlmann et al. 2016; Pejcha et al. 2016; Chamandy et al. 2018; Iaconi et al. 2019; Prust & Chang 2019; Reichardt et al. 2019; Sand et al. 2020; González-Bolívar et al. 2024; Kirilov et al. 2025). The final outcome of such an event can either be the complete coalescence of the two stars (e.g. Kruckow et al. 2016; Schneider et al. 2024) or the survival of the binary system but on tighter orbits (e.g. Ivanova & Nandez 2016; Sand et al. 2020).
The LRNe are identified through a few recurrent observational characteristics (see also Pastorello et al. 2019b for a review). Firstly, they present a light curve with a double (sometimes even triple; Tylenda et al. 2013; Kankare et al. 2015; Pastorello et al. 2019a; Cai et al. 2022b) peak. The first is a short-duration peak (∼1 week) that is typically very luminous and characterised by a blue colour. This first maximum is followed a few weeks to months later by a long-lasting second peak or a plateau-like phase, which is redder and usually fainter than the first one. While during the early peak the energy source is cooling emission produced by the initially hot ejecta, the longer plateau-like phase is powered by hydrogen recombination (see Metzger & Pejcha 2017; Matsumoto & Metzger 2022).
In a few cases, the precursors of LRNe are detected in profound pre-outburst archival images from ground-based facilities or space telescopes (Fraser et al. 2011; Mauerhan et al. 2015; Blagorodnova et al. 2017; Cai et al. 2019; Pastorello et al. 2021b; Blagorodnova et al. 2021; Cai et al. 2022b). From these detections, it is possible to measure the mass of the progenitor, and a convincing correlation between this mass and the peak luminosity of LRNe has been found (Kochanek et al. 2014; Blagorodnova et al. 2021; Cai et al. 2022b). However, after the second or third peak, LRNe fade beyond the detection threshold in the optical domain, even when using the largest astronomical facilities, leaving questions about the final fate of the progenitors of LRNe after the main outburst and the type of the merger outcome.
If LRNe were terminal events, we would not expect to detect a visible remnant nor a source that has become significantly fainter than the progenitor’s magnitude in the deepest images obtained with space telescopes. However, the disappearance of the source in the optical domain is not sufficient alone to prove a terminal stellar explosion. If the merger outcome is engulfed within a dusty shell, this would obscure the emission at the shorter wavelengths, and prevent detection of the merger outcome in the optical domain. As a consequence, the spectral energy distribution (SED) of the progenitor after the outbursts may shift towards longer wavelengths in the near-infrared (NIR) or even in the mid-infrared (MIR) domains. Indeed, it has been observed that dust can form in LRNe at late stages once the dense ejecta cools below the temperature for solid condensation (e.g. Wisniewski et al. 2008; Nicholls et al. 2013; Banerjee et al. 2015; Kamiński et al. 2015; MacLeod et al. 2017; Iaconi et al. 2020; Blagorodnova et al. 2020; MacLeod et al. 2022). Therefore, a post-outburst inspection in a very wide range of wavelengths is necessary to securely unveil the fate of an LRN.
In the past decades and centuries, a few LRNe have been observed in the Milky Way: CK Vul1 in 1670 (Shara et al. 1985; Kato 2003; Kankare et al. 2015), V4332 Sgr (Martini et al. 1999; Tylenda et al. 2005), OGLE-2002-BLG360 (Tylenda et al. 2013), V838 Mon (Munari et al. 2002; Bond et al. 2003; Tylenda 2005), and V1309 Sco (Mason et al. 2010; Tylenda et al. 2011). Another proposed Galactic object was V1148 Sgr (Mayall 1949; Bond et al. 2022), although its membership to the LRN class is still controversial. Given their proximity (a few kiloparsecs), the remnants of some of these events were studied in the MIR (Banerjee et al. 2006; McCollum et al. 2014; Kamiński et al. 2018) and even at longer wavelengths (far-infrared and sub-millimetre) by Herschel and ALMA (e.g., Tylenda & Kamiński 2016; Kamiński et al. 2020, 2021). Studies on these Galactic objects have also revealed strong evidence for bipolar ejecta (Eyres et al. 2017), which supports the scenario of the progenitors being in binary systems. The progenitors of these low-luminosity Galactic LRNe were all low-mass stellar systems, in agreement with the relation between LRN luminosity at maximum and the progenitor mass proposed by Blagorodnova et al. (2021) and later revised by Cai et al. (2022b).
In contrast, poorer constraints on the progenitors and their post-outburst outcomes are available for the intrinsically brightest LRNe, as they are usually observed in more distant galaxies and, with the exception of the Andromeda Galaxy, outside the Local Group. Characterising these sources is a priority because they are believed to arise from very massive stellar systems (up to 50 M⊙, as in the extreme case of AT 2021aess, Guidolin et al. 2025).
Mauerhan et al. (2018) conducted a search for the remnant of LRN AT 2014ib/SNHunt248 (Kankare et al. 2015; Mauerhan et al. 2015) using data from the main space telescopes. While a post-outburst source was clearly detected, the images they used were acquired only one year after the LRN onset and hence too early to be sure the merger’s aftermath settled into a stable state and for the dust to reveal the true stellar outcome. Similarly, Szalai et al. (2021) published a single epoch of MIR photometry for LRN AT 2017jfs (Pastorello et al. 2019a) obtained on October 2018 (after 10 months). The object was still bright, at 16 mag, but again the time delay from the outburst was still insufficient to provide reasonable constraints on the LRN survivor.
In this work, we present an archival search for optical, NIR, and MIR data of past extra-galactic LRNe in order to constrain the fate of the progenitors and characterise the resulting stellar products. The structure of the paper is as follows: In Sect. 2, we introduce the sample of LRNe and its selection criteria, and we describe the data sources as well as the data analysis techniques. The main results, including the LRN light curves, are reported in Sect. 3. In Sect. 4, we analyse the SEDs of the remnants, determine the masses of the newly formed dust, and provide our conclusions.
2. The sample and the observations
2.1. The sample
We analyse a sample of nine extragalactic LRNe documented in the literature. Only objects at least five years old (the oldest was discovered in 1997) in 2025 are considered. The fields of our targets were observed by space telescopes, preferentially in the IR domain. Given their extended wavelength coverage with respect to ground-based facilities, the lower sky background and, in some cases, their excellent spatial resolution (as they operate outside Earth’s atmosphere), the space telescopes can detect and resolve targets with fainter apparent magnitudes in outer galaxies. All the objects in our sample are nearby, being located within a distance of 40 Mpc. This increases the probability to detect the quiescent progenitors years before the LRN event and/or to recover the stellar survivors of LRN outbursts a long time later.
The sample also includes transients that were previously classified as SN impostors (AT 2007sv and AT 2015fx), but for which we now offer a LRN reclassification. The final sample is presented in Table 1. As for some objects an official International Astronomical Union (IAU) name was not available, we take the opportunity offered by this work to give them a proper IAU designation in the Transient Name Server2.
Luminous red nova sample analysed in this paper.
For each object, the phases considered in this paper are with respect to the epoch of the first, blue maximum. We also adopted the same distance and total extinction values as reported in their reference articles (see Table 1).
2.2. The observations
The imaging data analysed in this paper were obtained with different space facilities, including: 1. the Hubble Space Telescope (HST) with multiple cameras: the Wide Field and Planetary Camera 2 (WFPC2, Holtzman et al. 1995), the Wide Field Camera 3 (WFC3), and the Advanced Camera for Surveys (ACS, Sirianni et al. 2005); 2. the Spitzer Space Telescope (SST, Werner et al. 2004; Gehrz et al. 2007) with the Infrared Array Camera (IRAC, Fazio et al. 2004); 3. the Wide Infrared Space Explorer (WISE, Wright et al. 2010) during the Near-Earth Object WISE (NEOWISE, Mainzer et al. 2011, 2014) mission; 4. the James Webb Space Telescope (JWST, Gardner et al. 2006) with the Near Infrared Camera (NIRCam, Rieke et al. 2023) and Mid-Infrared Instrument (MIRI, Dicken et al. 2024).
We retrieved publicly available HST images from the Mikulski Archive for Space Telescopes (MAST3). For SST and WISE, we collected the images from the Spitzer Heritage Archive4 and the WISE Image Service5, respectively, both hosted at the NASA/IPAC Infrared Science Archive (IRSA6). The HST, SST, and JWST data were already fully reduced and flux-calibrated by dedicated processing pipelines (versions 2024.10.2.3, S19.2.0, 1.16.1, respectively), i.e. their counts have been converted into MJy/sr. For SST, we obtained the level 2 (post-basic calibrated data) images. For HST and JWST, we retrieved the level 3, calibrated images. The WISE images required a longer reduction procedure. We retrieved single-exposure frames obtained by the NEOWISE-Reactivation mission – which scanned the entire sky once every six months in the W1 (3.4 μm) and W2 (4.6 μm) filters – from the IRSA Archive. During each of these passages, individual fields can be observed several times within a few days. In these cases, we co-added those taken in this short temporal interval into a single stack image. Finally, we performed Point Spread Function (PSF) fitting photometry from a template-subtracted image. As templates, images obtained a long time (many years) before or after the outburst were used (see Sect. 3 for details). The WISE magnitudes were calibrated against the WISE All-Sky Data Release catalogue (Cutri et al. 2012).
To identify our targets in the high spatial resolutions images (from HST and JWST), we geometrically transformed the pre-outburst images with the detected progenitor to the late-time data. By doing this, we achieved high-precision relative astrometry between the two sets of data. We registered a number of point-like sources in common between the two datasets. Then, using geomap and geoxytran (two IRAF tasks), we carried out a geometrical transformation between the sets of coordinates. Later on, for all the objects we performed photometry with the PSF-fitting technique using the SNOoPY pipeline7 v. 3.2.024 – adapted to run on images taken with space telescopes – to obtain the instrumental magnitudes. The images from HST and JWST were then calibrated using zero points provided by the images or against a specific catalogue (see the text). The aperture correction calculated by the software was applied, while the local background was estimated by fitting it with a low-order 2D polynomial function, therefore accounting for its non-uniformity.
3. Results
In this section, all the magnitudes are reported in the AB mag system (Oke & Gunn 1983). The upper limits are calculated considering a detection threshold of 2.5σ. The photometric tables with the magnitudes for each object are available at the CDS. In all figures showing the location of the LRNe analysed in this paper within their host environments, north is up and east is to the left.
3.1. AT 1997bs
This object, known in the past with a SN designation (SN 1997bs), has been extensively studied in the literature (Van Dyk et al. 1999, 2000; Li et al. 2002; Kochanek et al. 2012b). The transient was initially considered an SN impostor, given its peak luminosity of only MV = −13.8 mag (Van Dyk et al. 2000). Van Dyk et al. (1999) identified a progenitor candidate in HST/WFPC2 images acquired in 1994, with an apparent magnitude of F606W = 22.86 ± 0.16 mag, corresponding to an absolute magnitude of MV ∼ −7.4 mag (see also Adams & Kochanek 2015 for an updated estimate of the progenitor’s colour). As discussed in Van Dyk et al. (2000), the colour evolution of the transient was peculiar, rapidly evolving towards redder colours, reaching V − I > 3 mag. Pastorello et al. (2019b) noted its light curve was reminiscent of those of LRNe, and proposed a reclassification of the object as a LRN.
Kochanek et al. (2012b) presented archival SST/IRAC images of the field of AT 1997bs taken during the Cold Mission in May 2004 (+7 years), but they only provided upper limits in the Ch1 filter (3.6 μm, indicated also as [3.6]) and Ch2 filter (4.5 μm, or [4.5]). However, from the analysis of the same dataset, Van Dyk & Matheson 2012 reported the detection of the source in those bands; they provide flux densities of approximately 40 and 50 μJy in the Ch1 and Ch2 filter, corresponding to 19.89 and 19.65 AB mag, respectively (see their Figure 4). In order to accurately estimate the magnitude of the post-outburst source in 2004 in all IRAC filters8, we applied the template-subtraction technique. For the Ch1 and Ch2 filters, we used very late SST images obtained in September 2019, when no source was detected at the LRN location, as templates. There is a marginal detection in the Ch1 filter image, and a more robust one in the Ch2 filter (Fig. 1, top). We also attempt to recover information of the source in the SST/IRAC Ch4 filter image by subtracting a JWST/MIRI F770W image (see below) as a template. For the Ch3 filter, the ideal template would be in the JWST/MIRI F560W band, but an image with this filter was not available. Therefore, we attempted to use the JWST F770W image again as a template. As this choice can lead to a wrong estimation of the source flux, we add a conservative systematic error of 0.1 mag. We tentatively identify AT 1997bs in Ch4 (Fig. 1, top right), and the source is also detected in Ch3.
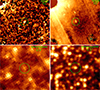 |
Fig. 1. Very late time detections of AT 1997bs. Top-left: Detection of AT 1997bs in an SST Ch2 filter image obtained in 2004 (after the subtraction of a template image). Top-right: Same, but for the Ch4 filter (using a JWST/MIRI F770W image as a template). The green circles are centred at the transient position and has a radius of 5″. Bottom-left: Detection of AT 1997bs in F814W filter in HST/ACS images obtained in 2023. Bottom-right: Detection of AT 1997bs in F150W-filter JWST/NIRCam images obtained in 2023. The green circle are centred at the position of the transient and have a radius of 0.15″. |
After the observations of Adams & Kochanek (2015), AT 1997bs is still barely detectable by HST/ACS in the F814W filter in 2019 (+22 years) and on 2023 May 10 (+26 years). In 2023, we measure F814W = 25.5 ± 0.3 mag, which matches the magnitude estimate in 2014 of Adams & Kochanek (2015), F814W = 25.5 ± 0.2 mag. As a consequence, the source has maintained a constant luminosity in the nine years between the two observations.
Deep JWST observations of the host galaxy NGC 3627 conducted in 2023 (+25.7 years) and 2024 (+27.7 years), with both NIRCam and MIRI, reveal that AT 1997bs is still detectable in the F150W (Fig. 1, bottom) and F200W images. AT 1997bs is barely detectable in the F277W filter, while it has finally faded below the detection threshold in the MIR.
3.2. AT 2007sv
AT 2007sv (formerly named SN 2007sv) was classified as an individual major outburst produced by a massive star (Tartaglia et al. 2015b). Smith et al. (2011) only reported a lower limit on the absolute magnitude of the progenitor of > − 11.7 mag. However, its light curves and spectra closely resemble those of LRNe, such as AT 1997bs, although the post-peak photometric evolution in the red bands shows a short-duration plateau rather than a broad peak. Though, the presence of a plateau is a quite frequent features in LRN light curves (Pastorello et al. 2023, and references therein). Tartaglia et al. (2015b) measured an outflow velocity of 2000 km s−1, which is difficult to reconcile with an LBV wind, whose speeds are usually up to 1000 km s−1 (see Smith 2017). Instead, it is consistent with the ejecta velocities observed in some of the brightest LRNe, such as AT 2014ib (Mauerhan et al. 2015) and AT 2021biy (Cai et al. 2022b) in the early phases. In addition, numerous absorption lines from Fe II, Sc II and Ba II are visible in the spectra. Based on all of these observables, AT 2007sv matches all the classification criteria of a LRN event.
SST observed the field of AT 2007sv in 2009 and 2010 (∼2 years after discovery), and the transient is clearly detected in the Ch1 and Ch2 filters (Fig. 2). The source shows a modest brightening between the first and second epoch, by 0.06 mag in Ch1 and 0.2 mag in Ch2, which is consistent with what has been observed in other LRNe presented in this work at late times.
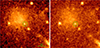 |
Fig. 2. Detection of AT 2007sv in 2010 images obtained by SST in the Ch1 (left) and Ch2 (right) filters. The green circles are centred at the transient position and have a radius of 3″. |
3.3. AT 2011kp (NGC 4490-OT2011)
AT 2011kp9 is a LRN studied by Smith et al. (2016) and Pastorello et al. (2019b). Fraser et al. (2011) found a progenitor candidate in an archival HST image before the outburst, with an absolute magnitude of F606W = −6.2 mag. Unfortunately, no colour information was available for this source. However, Smith et al. (2016) inferred an initial mass of 20–30 M⊙ for the progenitor.
Smith et al. (2016) presented optical (HST) and mid-infrared (SST) observations up to +2.5 years of AT 2011kp, in which the object was still visible. Here, we analyse more recent data obtained after those published in their paper. Notably, while the LRN is still detected in the F814W filter in October 2013 (Fig. 3, left), only 3 months later (in January 2014), the source suddenly vanishes (Fig. 3, centre). The same result is obtained in August 2014, and in October 2014 with the F547M filter. However, the source does not disappear in all optical filters given that, at the same epoch, a very faint source is seen at the LRN position in a F657N-filter image (centred on the Hα emission line, Fig. 3, right). This implies that the outcome of the LRN event is still emitting in the Hα line.
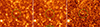 |
Fig. 3. Images from HST of the field of AT 2011kp. Left: F814W filter image obtained on 2013 October 30. Centre: F814W filter image taken on 2014 January 12. Right: F657N HST image obtained on 2014 October 23. The green circles are centred at the coordinates of the transient and have a radius of 0.5″. |
In contrast with the optical follow-up, AT 2011kp remained visible in the MIR at least for eight years, until the retirement of the SST spacecraft (see the MIR light curve in Figure 4). In the first observation reported by Smith et al. (2016) (at +1 year), the MIR colour is still relatively blue, at [3.6]−[4.5]= − 0.37 mag. From 2014, the MIR light curves decline quite slowly for about four years, with a rate of ∼0.45 ± 0.04 mag yr−1 in both filters. In the same period, the [3.6]−[4.5] colour slowly increases from 0 mag at +3 years to 0.2 mag at +6 years (corrected for an extinction of E(B − V) = 0.32 mag, as suggested by Smith et al. 2016 and Pastorello et al. 2019b). The trend of diminishing in brightness while becoming only mildly redder can be an indication that the emitting material is not actually cooling. This can be explained with an IR echo (Dwek 1983; Graham & Meikle 1986; Meikle et al. 2006; Mattila et al. 2008) from distant, pre-existing circumstellar dust surrounding the central engine of the transient, as observed in V838 Mon (Crause et al. 2005; Tylenda 2005). From 2018, the decline rate of the Ch1 light curve becomes steeper, and the [3.6]−[4.5] colour also increases more rapidly to 1.1 mag at +7 years, which is remarkably similar to the colour of AT 1997bs at the same phase, while the Ch2 light curve does not change its slope. The [3.6]−[4.5] colour curve is shown in the Appendix (Figure A.1). Finally, at +7.5 years, AT 2011kp is no longer detectable in the Ch1 images, but it is still visible in the Ch2 filter, at least until +8.1 years, with the source being more than 3 magnitudes fainter than in 2012. This is the last available epoch, as SST ended its operations.
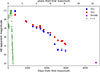 |
Fig. 4. Mid-infrared light curve of AT 2011kp spanning 12.5 years of evolution. The 2024 JWST/NIRCam F444W filter measurement is also shown as its bandpass is similar to that of the Ch2 filter. Upper limits are marked with downwards arrows. For reference, the r-band light curve published by Pastorello et al. (2019b) is also shown with green squares. |
The host galaxy NGC 4490 was observed by JWST/MIRI in December 2023. AT 2011kp is well detected in both the F560W and F770W filters images (Fig. 5, panels a and b), despite the observations being conducted more than 12 years after the LRN outburst. Finally, JWST observed NGC 4490 again with NIRCam in February 2024 (12.5 years after the LRN outbursts) in multiple NIR filters from F115W to F444W (Fig. 5, panels c and d). AT 2011kp is still well detectable in all filters (though it is faint in the bluest ones), and it is brighter at the longest wavelengths, indicating a red colour and a cool continuum temperature. The F444W flux aligns reasonably well with the linear decline shown by the Ch2 filter between 2012 and 2019 (Fig. 4). In contrast, AT 2011kp is not detected in the bluer F200W and F150W wide filters. The non-detection of the remnant of AT 2011kp in the NIR, when instead it is bright in the MIR, evidences how its SED is dominated by a very cool emitting source.
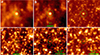 |
Fig. 5. JWST MIRI and NIRCam images of AT 2011kp. Panels are as follow: (a): F770W, (b): F560W, (c): F444W, (d): F335M, (e): F187N, and (f): F115W. In the MIR, a bright source is clearly visible 12.5 years after the first peak. In the top row stamps, the green circles are centred at the position of the transient and have a radius of 0.5″. In the F335M stamp, the circle has a radius of 0.3″, while in the F187N and F115W stamps it has a radius of 0.1″. The latter two stamps are more zoomed-in to better identify the counterpart. |
3.4. AT 2013lw (UGC 12307-OT2013)
AT 2013lw (or UGC 12307-OT2013) was classified as a LRN by Pastorello et al. (2019b). The epoch of the first blue peak is not known, as the object was discovered at a late evolutionary stage. We detect AT 2013lw in SST Ch1 and Ch2 images acquired on August 2014 (13 months after the red peak), after subtracting a template SST image obtained in 2009 (Fig. 6).
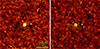 |
Fig. 6. Detection of AT 2013lw in the template-subtracted 2014 images obtained by SST in the Ch1 (left) and Ch2 (right) filters. The green circles are centred at the transient position and have a radius of 3″. |
3.5. AT 2015fx (PSN J09132750+7627410)
AT 2015fx (also known as PSN J09132750+7627410 and NGC 2748-2015OT1) was classified as an SN impostor by Tartaglia et al. (2015a, 2016) on the basis of its peak absolute magnitude Mr = −13.6 and the spectral appearance. However, similarities with AT 2007sv, AT 1997bs, and AT 2014ib were noted. In fact, the light curve presented an early blue peak followed by a plateau lasting ≈150 days. The early spectra were characterised by a blue continuum and narrow Balmer lines with P-Cygni profiles, indicating low expansion velocities of < 1000 km s−1. As the spectra evolved in the following three months, the continuum become redder, while Balmer lines weakened, and absorption lines from metals started to appear. In the final spectrum, broad absorptions from TiO molecular bands also appeared, a common feature in LRNe at late phases. Tartaglia et al. (2016) found a plausible progenitor star for AT 2015fx in HST/WFPC2 F450W and F814W images being a white-yellow supergiant of 18–20 M⊙10, while the majority of SN impostors tend to originate from blue stars. They also detect the progenitor in SST/IRAC images. The progenitor’s properties are similar to those of another well-studied LRN, AT 2021biy (Cai et al. 2022b). Based on the photometric and the spectroscopic similarities of AT 2015fx with other LRNe, the colour and mass matches of the progenitor with that of AT 2021biy, and its disappearance in the 2019 optical image, we propose its reclassification as a LRN.
We retrieved HST/WFC3 images of the field of AT 2015fx in the F555W and F814W filters acquired in October 2016 (1.7 years after the outburst). The transient is not detected in the F555W filter. Instead, it is tentatively detected in the F814W-band image (Fig. 7). This source is ∼2.7 mag fainter than the progenitor identified by Tartaglia et al. (2016) in the same filter (F814W = 24.00 ± 0.18 mag). Recently, Baer-Way et al. (2024) verified the disappearance of the progenitor of AT 2015fx also in the F814W filter, based on a later HST/WFC3 image acquired in February 2019, although they do not report the limit, which we measured.
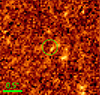 |
Fig. 7. Possible detection of AT 2015fx by HST/WFC3 in the F814W filter in 2016. The green circle is centred at the transient position and has a radius of 0.2″. |
MIR observations of the location of AT 2015fx were performed by WISE, that targeted the field four times in 2015 and 2016. However, we do not detect the transient in the W1 and W2 filters at any epoch. The non-detection in the MIR is probably a consequence of its larger distance (24 Mpc), hence a shallower absolute magnitude detection limit.
3.6. AT 2015dl (M101-2015OT1)
AT 2015dl11 has been extensively studied by Blagorodnova et al. (2017). They found its progenitor to be an F-type yellow supergiant with an estimated mass of 18 M⊙, which disappeared in the optical bands at late times, as proved by their deep images from the Keck telescope. To improve the characterisation of this LRN, in this paper we analyse more recent ground-based optical and NIR images, along with a much wider dataset in the MIR domain. In particular, we update the light curve of AT 2015dl in the MIR bands after a re-analysis of the SST data published by Blagorodnova et al. (2017), and extend the photometric monitoring by further four years, including previously unpublished WISE data and more recent SST observations.
We retrieved level-2 calibrated r-band images of the field of AT 2015dl obtained with the 3.58m Canada France Hawaii Telescope (CFHT) with MegaPrime. These images, acquired on 2017 March 22 and 23 (+2 years), are deep and taken with excellent seeing conditions (∼0.45″). We calibrate them against the Pan-STARRS1 catalogue (Chambers et al. 2016). We do not detect any source down to r > 25.5 mag, which is a much fainter limit than the quiescent progenitor level reported by Blagorodnova et al. (2017) (∼21 mag).
We also retrieved a single K-band image from the UKIRT telescope with the WFCAM instrument obtained on 2019 June 14 (+4.3 years), which was calibrated against the 2MASS catalogue (Cutri et al. 2003). No source is detected to a limit of K > 20.8 mag (AB scale). While this limit is brighter than the quiescent progenitor (K = 21.44 ± 0.11, converted to AB, Blagorodnova et al. 2017), it confirms the luminosity decline of the transient in the NIR region a few years after the outburst.
SST observed the region multiple times between 2015 and 2019. Although the data obtained from April to September 2015 were already published by Blagorodnova et al. 2017, for consistency, we remeasured them. Our measurements well matches theirs. AT 2015dl remains visible in the MIR for years after the outburst, as is still detected nearly five years after the first maximum. The final MIR light curve is shown in Figure 8. The field was also imaged twice by SST on 2004 March 8 – during the Cold Mission – with all IRAC filters, hence the two exposures in the same filters could be combined to obtain deeper upper limits to the progenitor luminosity.
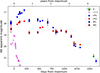 |
Fig. 8. Mid-infrared SST and WISE light curves of AT 2015dl spanning over 4.5 years of evolution. A K-band upper limit from UKIRT/WFCAM is also shown. Downwards arrows mark the upper limits. For reference, the r-band light curve published by Blagorodnova et al. (2017) is also shown with magenta squares. |
WISE monitored the field around AT 2015dl in multiple occasions between December 2014 (i.e. 2 months before the optical peak) and March 2018 (3 years later). Given the modest space resolution of the WISE observation, the photometric data were obtained after the subtraction of the host galaxy contamination. As a template, we used WISE images obtained on June 2010. The first observation of WISE, on 2014 December 19, was obtained about 50 days before the official announcement of the LRN discovery (on 2015 February 10), hence during the slow luminosity rise before the LRN outburst onset. The W1 − W2 colour during the pre-outburst rise is ∼ − 0.6 mag.
In 2015, AT 2015dl is observed to brighten in the MIR, reaching a maximum about eight months after the r-band peak. Later, the light curve starts a general declining trend, with some fluctuations (Fig. 8). Another SST epoch with both Ch1 and Ch2 filters was acquired on 2018 September 18, and a final Ch1 observation was obtained on 2019 August 2. In the latter image, while the source is located at the edge of the frame (see Fig. 9), it is ∼4 mag fainter than at maximum, and just 0.5 mag brighter than the upper limit on the progenitor obtained in the same filter from the 2004 SST observations.
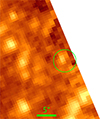 |
Fig. 9. AT 2015dl in the SST image obtained on 2019 August 2. Despite being imaged at the edge of the frame, the source is still detectable. The green circle, centred at the transient position, has a radius of 3″. |
At the time of the r-band observation (+2 years), the r − [3.6] colour of AT 2015dl is at least 7.2 mag. Very high optical–IR colours are usually interpreted as an indication of dust condensation. While the object is not detected in the optical, it is still bright in the SST Ch1 filter. This is similar to the behaviour shown by V1309 Sco in the optical/infrared bands (Nicholls et al. 2013; Tylenda & Kamiński 2016).
Starting from +2 years, we note a dramatic evolution in the MIR colour: The [3.6]−[4.5] colour changes from ∼ − 1.0 mag (this colour index remains stable between +6 months and +1.5 years), to ∼ − 0.3 mag at +775 days, and then rises to +0.0 mag at +850 d. Finally, the colour continues to increase up to [3.6]−[4.5]= + 0.3 mag in the last available observation with the Ch2 filter, at +3.6 years. Together with the continuous decline in luminosity observed in both filters, this large colour variation is an indication of a cooling in the expanding material. The MIR [3.6]−[4.5] and W1 − W2 colour curves are shown in the appendix (Fig. A.1).
3.7. AT 2018bwo
This LRN was studied in detail by Blagorodnova et al. (2021) and Pastorello et al. (2023). Its progenitor was identified as a yellow giant of M ≈ 11–16 M⊙ by Blagorodnova et al. (2021).
We retrieved an HST/WFC3 image acquired with the F350LP filter on October 2022. The filter is very wide and covers the entire optical range12, from 3500 to 10 000 Å, hence is roughly equivalent to a Clear filter image. A source is detected at the position of the candidate progenitor detected by Blagorodnova et al. (2021) in HST images acquired in 2004 (Fig. 10). Although the source is much fainter than the progenitor (the optical magnitude was ∼23) and no colour information is available, this late detection (at an absolute magnitude of MF350LP ∼ −1.7 mag) indicates that four years after the outburst the source at the location of AT 2018bwo is fainter than the quiescent progenitor, at least in the optical domain.
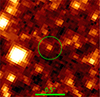 |
Fig. 10. HST/WFC3 image of the field of AT 2018bwo taken with the F350LP filter on 2022 October 1. The green circle is centred at the transient position and has a radius of 0.2″. |
3.8. AT 2019zhd
AT 2019zhd is the third LRN observed in the Andromeda Galaxy, after M31-RV (Mould et al. 1990; Boschi & Munari 2004) and M31-LRN2015, (Kurtenkov et al. 2015; Williams et al. 2015; MacLeod et al. 2017; Lipunov et al. 2017; Blagorodnova et al. 2020).
Pastorello et al. (2021a) conducted a detailed study on this object, and in particular analysed a set of HST/WFPC2 images acquired in 1997 searching for the progenitor stellar system. These images did not allow the authors to securely identify a progenitor star. At the exact LRN coordinates, no source was visible down to limiting magnitudes of F439W ∼ 25.6 mag, F814W ∼ 25.7 mag, and F814W ∼ 25.4 mag. However, three sources were found in the proximity of the LRN location, labelled as sources A, B and C in that paper. None of their position perfectly matched that of the LRN centroid (see Fig. 9 in Pastorello et al. 2021a). However, among the three sources, only source C was outside the 0.31″ error-box radius. For this reason, the other two sources were still considered potential progenitor candidates, with source A being the most plausible. We retrieved HST/ACS images acquired in January 2022 (+1.9 yr) of the field of AT 2019zhd, with the F814W filter. The transient is clearly detected (Figure 11, left panel), within the 0.31″ positional uncertainty mentioned above, and is clearly distinct from the three sources identified by Pastorello et al. (2021a). For this reason, we can now safely rule out any of them being the progenitor of LRN AT 2019zhd.
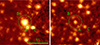 |
Fig. 11. HST/ACS images taken in 2022 of the field of AT 2019zhd. Left: Detection in the F814W filter. Right: Detection in the F475W filter. The green circles are centred at the transient position and have a radius of 0.31″. The three sources identified by Pastorello et al. (2021a) are also labelled. Notably, none of them match the position of AT 2019zhd. |
AT 2019zhd is also detected by HST/ACS in the F475W filter in July 2022. Although the detection of a source in a blue filter such as F475W is somewhat unusual if it is obscured by dust, the F475W − F814W colour (close to Sloan g − i) estimated for AT 2019zhd in this phase is 4.4 ± 0.1 mag (corrected for an extinction of E(B − V) = 0.055 mag). At the distance of M 31 (0.78 Mpc), the absolute magnitudes of AT 2019zhd in 2022 are MF814W = −3.94 and MF475W = +0.42 mag. These parameters of colour and luminosity are consistent with those of a M6-9 giant star as the survivor of the LRN event, as we will determine in Sect. 4.1.
While AT 2019zhd is not detected by WISE on 2019 December 26, at a time close to the first blue peak (template from January 2014 with limits: W1 > 18.8, W2 > 18.3 mag), it is seen in the W1 filter in July and December 2020, 7 and 12 months after the outburst, respectively. This late detection in the MIR is remarkable considering that the optical follow-up of the transient lasted less than two months.
3.9. AT 2020hat
AT 2020hat was studied by Pastorello et al. (2021b), and in 2017 HST/ACS images they found a K-supergiant star as a possible progenitor. We retrieved SST images acquired between 2007 and 2019 in Ch1 and Ch2. In the 2007 images, we estimate profound limits to the progenitor brightness. We use these images as templates for more recent observations.
Between 2014 and 2018, upper limits on the difference images are obtained after the subtraction of the 2007 templates. Later, between May and November 2019 (before the end of the mission), we observe a slow rise in luminosity in the final four SST observations with the Ch1 filter (Fig. 12). This slow luminosity rise observed in the MIR mirrors the one observed in the optical filters prior to numerous LRNe. However, so far, AT 2020hat is the only extragalactic LRN for which the pre-outburst rise is observed in the infrared domain. A single Ch2 image is available at the same epoch as the last Ch1 observation (Fig. 13, left panel). From this point, the [3.6]−[4.5] colour is ∼ − 0.52 mag, hence the object was remarkably blue at that phase, similarly to AT 2015dl. This is an indication that the pre-outburst IR emission likely originated from a hot photosphere rather than from cold, pre-existing dust.
 |
Fig. 12. Mid-infrared light curve of AT 2020hat before (from SST) and during (from WISE) the outburst. Downwards triangles mark upper limits. For reference, the r-band light curve from Pastorello et al. (2021b) is also shown with green squares. |
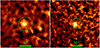 |
Fig. 13. Detection of AT 2020hat in the MIR template-subtracted images. Left: Last Ch1 observation from SST (on 2019 November 21). Right: WISE W1 observation performed on 2020 June 24. The green circles are centred at the transient position and have radii of 3″ and 10″, respectively. |
Two epochs of WISE imaging were obtained after the outburst (templates from January 2014). In the first epoch (2020 June 24, hence 70 d post r-band maximum), we detect a source at the LRN position only in the W1 filter (Fig. 13, right panel), 4.3 magnitudes brighter than the earliest Ch1 measurement (obtained 11 months prior). This is similar to the steep luminosity jump observed in the optical bands from the pre-outburst level to the maximum light (Pastorello et al. 2021b). Instead, at the same epoch, an upper limit is inferred in the W2 filter, which indicates the source was rather blue around peak, with a colour of (W1 − W2)0 < 0.05 mag. Finally, nine months after the r-band maximum (in January 2021), a second epoch of WISE imaging was obtained, and only upper limits are measured in both filters, indicating the source has faded by at least 1.1 mag also in W1 seven months after the previous measurement. The full MIR light curve is shown in Figure 12.
The host galaxy NGC 5068 was imaged by JWST in 2023 in multiple filters. Unfortunately, the location of AT 2020hat was just outside the images footprint, and thus the object was not observed.
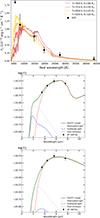 |
Fig. 14. Spectral energy distributions of AT 1997bs. Top panel: SED ∼27 years after the outburst from HST/ACS and JWST/NIRCam observations. The SED is compared to ATLAS9 stellar atmospheric models from Castelli & Kurucz (2003). Good matches are found with models with temperatures between 3750 and 4250 K, and radii between 150 and 120 R⊙. Middle panel: SED at the time of the 2004 SST observations. This cooler SED is fitted with a DUSTY model with a 100% silicate composition, a dust temperature of Td = 600 K, a source temperature of Ts = 4000 K, and an optical depth of τV = 68.5. Bottom panel: Same but for a model with a 100% AMC composition and optical depth of τV = 16. |
4. Discussion
The majority of the LRNe analysed in this work had relatively massive progenitors, in the range 10–25 M⊙, as inferred from the publications on individual objects. The only exception is AT 2019zhd which, given its low peak luminosity of −9.6 mag, is most likely a low mass object (3.4 M⊙ as reported by Pastorello et al. 2023; 6 M⊙ according to Chen & Ivanova 2024). Nonetheless, its fate seems to be similar to that of LRNe produced by more massive systems (see below). These masses were determined through archival images from HST by measuring the luminosity and colour of the progenitor system, positioning them in an HRD and compare with evolutionary tracks of binaries. Another approach is to implement the empirical relation between V-band absolute magnitude at the second peak and progenitor mass revised by Cai et al. (2022b).
A general trend that seems to emerge from this research is that LRNe tend to fade well below the progenitor level in the optical bands, while remaining bright in the NIR and (even more) in the MIR for many years after the outburst. An high IR luminosity seems to be an ubiquitous feature of the light curves of LRNe at late phases, determining a shift of the SED peak towards the MIR domain. The very late time detections of LRNe in the IR domain can be easily explained with the formation of a conspicuous amount of new dust in the months/years after the outburst. This statement is also supported by the evidence of a blue-shift of the spectral lines observed in the late-time spectra of LRNe (e.g., Mason & Shore 2022). For instance, M31-LRN2015 (not included in our sample), was detectable in the K-band for more than two years, and was still detected by Blagorodnova et al. (2020) in the SST Ch2 filter nearly five years after the outburst, while it was below the detection threshold in the optical and NIR bands, as well as in the SST Ch1 images.
4.1. Spectral energy distributions of the remnants
We constructed the SED of AT 1997bs in 2023-2024 by combining the information from the HST (F814W) and JWST filters (F150W, F200W, F277W, plus the limit in F444W). We compared it with the ATLAS9 stellar atmospheric models by Castelli & Kurucz (2003)13. We adopted the models with Z/Z⊙ = 1 (hence log(Z) = 0.0) and log(g) = 1.0. We find good matches for models with photospheric temperatures between 3750 and 4250 K, and stellar radii between 150 and 120 R⊙ (for the hottest and coldest models, respectively)14. Their corresponding bolometric luminosities are (1.61 ± 0.06 ± 0.10)×1037 erg s−1 (hence, log(L/L⊙) = 3.62 ± 0.02 ± 0.03). The matches of the ATLAS9 models to the remnant’s SED are shown in Fig. 14, left panel. These parameters are consistent with those of a red giant star as the outcome of the AT 1997bs merging event, thus ruling out it was a terminal SN explosion or an SN impostor from a blue massive star, such as an LBV. Recently, Steinmetz et al. (2025) also constrained the outcome of the Galactic LRN OGLE-2002-BLG-360 to be a red giant star, with an effective temperature of 3200 K and a radius of 300 R⊙. Finally, from our +3 yr HST observations of AT 2019zhd, we find that its remnant is also compatible with the colour and luminosity of a red giant star (unless the source is heavily extincted). We stress that this red giant state is the outcome of the coalescence of two stars, and not the traditional stellar evolution determined by changes in nuclear core burnings. We compared the SED of the outcome of AT 2019zhd with the PHOENIX stellar atmospheric models by Husser et al. (2013)15. We adopted the models with [Fe/H] = 0.0 and log(g) = 1.0. We find a good match for the models with photospheric temperature of 3000 and 3200 K, and stellar radii of 400 and 300 R⊙, respectively. Their corresponding bolometric luminosities are log(L/L⊙) = 4.07 and 3.93, respectively. The matches of the PHOENIX models to the remnant’s SED are shown in Fig. 15. This effective temperature of T = 3100 ± 100 K means that the object, if it is a star, might be located to the right of the Hayashi line, hence not (yet) in hydrostatic equilibrium, as it was observed only three years after the merger, or it is affected by dust extinction.
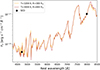 |
Fig. 15. Spectral energy distribution of the remnant of AT 2019zhd compared to PHOENIX stellar atmospheric models from Husser et al. (2013). The PHOENIX spectra have been convolved with a Gaussian kernel with a width of 20 Å. Matches are found with models with temperatures of 3000 and 3200 K, and radii of 400 and 300 R⊙. |
4.2. The dusty environment
From the +27 yr SED of AT 1997bs, we also note the lack of a MIR excess. In fact, the source is not detected at 4.4 μm, hence the dust formed years prior (responsible for the SST detection in 2004) either evaporated in the subsequent two decades, or the dust temperature has largely decreased, moving the peak of a putative cold SED component towards longer wavelengths. For instance, JWST observations of SN 2014C after 10 yr reveal that the dust has cooled to temperatures of 200–300 K (Tinyanont et al. 2025), and therefore the SED would peak at 10–15 μm.
The outburst of AT 2011kp occurred in a widely observed galaxy, giving us one of the rare opportunities to obtain well-sampled IR light curves for a LRN. In particular, we can study the temporal evolution of its SED, hence constraining the evolution of the temperature of the different emitting regions, including the coldest component which is attributed to dust emission. Smith et al. (2016) analysed the SED of AT 2011kp at 900–1000 days (∼3 years) after the LRN onset, estimating the temperature of the dust to be 725 K and constraining its location at a distance of 80 AU.
We can update the dust parameters characterisation by constructing the SED of AT 2011kp using more recent SST Ch1 and Ch2 observations obtained in 2018 (7 years after the LRN outburst), when the object shows a very red MIR colour, [3.6]−[4.5]= + 1.6 mag. Unfortunately, only two filters are available to constrain the temperature, hence the results are necessarily very uncertain. The extinction-corrected two-band SED is fitted by a cold black body (BB) (only due to the lack of more points) with an effective temperature of 508 ± 55 K and a radius of 210±60 AU, suggesting that the dust temperature progressively declines, while the radius of the dust emitting region increases.
Adopting the same approach for all the SST epochs, we can actually reconstruct the evolution of the radius, temperature and luminosity of the BB. The corresponding curves are plotted in Fig. A.2. In particular, the evolution of the radius mirrors that of the colour curve. The object is very hot (T ∼ 5000 − 6000 K) and luminous (∼1041 erg s−1) at +1 year, while it cools down to ∼1000 K and becomes much dimmer between +2.5 and +6 years. Looking again at Fig. A.2, we note that RBB of AT 2011kp between +2 and +6 yr is roughly constant, while TBB is slowly decreasing. We fitted the temperature evolution with a function At−0.5, which provides a good fit (χd.o.f.2 ≃ 2.63) to the data at those phases. Both are theoretical expectations for an IR echo from pre-existent dust (Smith et al. 2016). Instead, between +6 and +7 yr, TBB drops faster, while RBB is rapidly increasing, and the MIR colour also increases (Fig. A.1). All together, these are observational evidences of rapid dust formation (Kotak et al. 2009; Meikle et al. 2011; Gall et al. 2014).
The most recent observations publicly available of the AT 2011kp site were obtained by JWST in late 2023 and early 2024, about 13 years after the LRN outburst. Merging those data obtained in multiple bands, we construct a well-sampled SED. AT 2011kp is a strong emitter in all filters at wavelengths > 3 μm, especially at 7.7 μm. Another source is visible at only 0.08″ (3.5 pc at the distance of NGC 4490) east of AT 2011kp in all the NIR filters (see Figure 5, panel f). AT 2011kp is also detected in the F187N (Fig. 5, panel e), which covers the region of the Paschen α emission line. We remark that the LRN spectra at late phases, along with molecular bands of TiO and VO, show clear Hα emission lines (see Pastorello et al. 2019b). This makes the contribution of the Paschen α emission line plausible in the late detection in the F187N band16. Finally, we note that in the F187N-band image the source at 0.08″ from the LRN location is not unequivocally detected. This suggests that the source in the proximity of AT 2011kp has a stellar continuum.
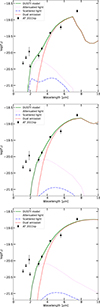 |
Fig. 16. Spectral energy distribution of AT 2011kp as obtained from JWST observations performed in 2023 and 2024 (13 years after the LRN onset), from 1.15 to 7.7 μm (black points). Downwards arrows mark upper limits. The SED is best-fitted with three DUSTY models with different chemical compositions: 100% silicates (top panel), 50% silicates + 50% AMC (middle panel), and 100% AMC (bottom panel). Contributions from dust emission, attenuated, and scattered light are also shown. The excess at 1.8 μm is marked with a rhombus. |
The origin of the excess flux at 7.7 μm could be due to the presence of dust composed of silicates – indicative of an O-rich environment, which have a peak in opacity at around 8–10 μm (Draine & Lee 1984). Alternatively (though less likely), the F770W-filter excess can also be caused by emission from polycyclic aromatic hydrocarbons (PAHs), observed in the MIR SED and spectra of other IGTs (Prieto et al. 2009; Valerin et al. 2025), which instead are typical of C-rich ambients. Observations of the AT 2011kp field with JWST/MIRI at longer wavelengths (with F1000W and even redder filters, and/or a MIR spectrum) would help resolving this conundrum.
The most important outcome of our analysis is that a significant amount of dust has likely formed after the LRN event, and has progressively cooled over the course of the past decade. To understand if LRNe can be considered dust factories (as suggested also by Karambelkar et al. 2025), it is interesting to compare the results of the late-time follow-up of LRN AT 2011kp with those of two ILRTs with extensive long-term monitoring in the IR domain, viz. AT 2008jd (best known as NGC300-2008OT, e.g. Ohsawa et al. 2010; Kochanek 2011) and AT 2019abn (Valerin et al. 2025). The two objects were observed by WISE, during the Cold mission (also including the W3 and W4 filters at 12 and 22 μm), and JWST/NIRCam and MIRI, respectively. A dust temperature of 580 K and 380 K was inferred for AT 2008jd (at phase +2 years) and AT 2019abn (after 5 yr, although influenced by the presence of emission from PAH), respectively (Valerin et al. 2025). From this comparison, the dust temperature seems to fade more rapidly in ILRTs than in LRNe. In brief, these two types of IGTs have different properties during the explosive event in the optical domain whilst, for both, the SEDs at late epochs peak in the MIR region, although with different timescales. This is another parameter that may support the observational discrimination between the two IGT families. It also suggests that both classes are efficient dust producers.
4.3. Dust modelling and masses
Assuming that the source of the MIR radiation is heated dust, we can estimate its mass, temperature and chemical composition by fitting the IR SED with dust emission models. We used the radiative transfer code DUSTY (Ivezic & Elitzur 1997; Ivezic et al. 1999b,a) to derive these physical parameters. We assume a simple scenario with a spherically symmetric dust shell and a central hot source, a standard Mathis et al. (1977) distribution for dust grain sizes, a ρ ∝ r−2 radial density profile and a shell’s relative thickness Y = Rout/Rin = 2, as in Kochanek et al. (2012a). To estimate the best-fit model and the associated uncertainties, we explored the parameters space by implementing a grid of models as described in Appendix B, and select the model with the lowest χ2. For the central source, we assume a BB radiation with a temperature of 3500 K, close to that estimated for the stellar remnants of LRNe in Sect. 4.1. We considered multiple combinations of chemical compositions of the dust, for both the cases of O-rich (in the form of silicates) and C-rich ambients. We prefer amorphous carbon (AMC) instead of graphite as in C-rich environments dust tends to be in the form of the former (Zubko et al. 1996; Marini et al. 2021). Anyway, the environment around an M-type star and a merger event is more likely to be O-rich rather than C-rich, and therefore we expect the dust to be composed of silicates (Banerjee et al. 2004). The mass of the dust is determined through the same procedure as in Lau et al. (2025) (see the equations in their Appendix A). The parameters associated to each best-fit model are presented in Table 2.
Properties of the best-fit DUSTY models to the SEDs of AT 2011kp and AT 1997bs.
To characterise the IR emission of AT 1997bs at late phases, we start reanalysing the SST observations obtained in 2004 and presented by Kochanek et al. (2012b) and Van Dyk & Matheson (2012). Our analysis suggests that a source is visible in all four IRAC filters. With these data, we construct the MIR SED about seven years after the discovery of AT 1997bs.
For AT 2011kp, the best-model fits are found with a mixed composition of both silicates and AMC, and with pure AMC (Fig. 16). The optical depth τV of the shell is 46 and 33, respectively. The temperature of the dust at the inner side of the shell is 450–475 K, while the inner radii of the dusty shell are also similar to each other, at 370 and 470 AU, respectively. Finally, we derive dust masses of 4.6 and 2.0 × 10⁻⁴ M⊙. The velocity needed by the ejecta to reach a distance of 370 (470) AU in 12.5 years is ∼140 (180) km s−1, the same determined by Smith et al. (2016) (160 km s−1). These models fit reasonably well the data obtained at wavelengths longer than 3 μm, including the excess at 7.7 μm. However, they miss the points at shorter ones. In particular, a strong excess in the F187N filter remains, which could be explained with a Paα emission line from the circumstellar medium (CSM), which suffers less extinction than the remnant. The model with a 100% silicates composition has a much larger χ2 and is thus unfavoured.
For AT 1997bs, we changed the source temperature to 4000 K, equal to that of the remnant observed 20 years later. A best-fit (Fig. 14, middle panel) is found for a model of a dusty shell composed entirely of silicates, at a temperature on the inner side of 600 K, and an optical depth τV of ∼68. The dusty shell is located 300 AU from the central source, and contains 1.0 × 10⁻³ M⊙ of dust. Given the shorter amount of time passed since the merger, at this stage the dust is hotter with respect to AT 2011kp. Another fit, this time with a shell made only of AMC, is found for a model again with Tdust, in = 600 K, and τV = 16 (Fig. 14, bottom panel). The inner radius of the dusty shell is 320 AU, and amasses 7.0 × 10⁻⁵ M⊙ of dust. The lower mass of dust in the case of dust made of AMC is due to its opacity per unit mass being higher than for silicates, and an overall lower τV. These distances (300–320 AU) travelled in 7 years correspond to an ejecta velocity of ∼200 km s−1.
As a reference, the mass of dust produced by V838 Mon is also a few ×10−4 M⊙ (Kimeswenger et al. 2002; Banerjee et al. 2003; Exter et al. 2016). Assuming a standard gas-to-dust ratio of 100:1 (as in Dwek 1983; Mauerhan et al. 2018, but see Sarangi et al. 2025), the dust masses we inferred imply a total CSM mass of few 10−2 M⊙, which can also explain the putative detection of the Paα emission line in the late-time SED of AT 2011kp.
The dust masses of AT 1997bs and AT 2011kp are similar to those found for other LRNe at very late times by Karambelkar et al. (2025), and higher than the range of masses determined for AT 2014ib (3 × 10⁻⁶ to 3 × 10⁻⁵ M⊙) by Mauerhan et al. (2018). However, these values are lower than those found for other types of IGTs, such as ILRTs (up to 2 × 10⁻³ M⊙, Valerin et al. 2025) and in normal SNe (e.g. Fabbri et al. 2011; Bevan & Barlow 2016; Bevan et al. 2020)17.
As a final note, the dust masses we obtained are likely to be lower limits because our longest-wavelength observations are at around 8 μm. Therefore, we miss the contribution from much colder, further away dust that may be present.
4.4. Concluding remarks
In this work, we have inspected very late optical, NIR and MIR images for a sample of LRNe studied in the literature. The main goal was the characterisation of the LRN survivors. The sample we used includes two IGTs (AT 2007sv and AT 2015fx) that were previously classified as SN imposters and produced by bright outbursts from massive stars. Re-analysis of their previously observed properties together with the new argument we offer of late detection in the NIR support the reclassification of the two events as LRNe. This reclassification is a first step in our effort to simplify the observational ‘zoo’ of IGTs, which contains a significant variety. In fact, we propose that individual short-duration eruptive events are more likely to result from merging events in close binaries rather than the violent eruptive mass loss attributed to very massive stars.
We recovered AT 2011kp 13 years after the LRN event in JWST images, demonstrating that LRNe may remain bright in the MIR for many years. The SED of AT 2011kp in 2024 can be explained by a cool remnant source surrounded by a cold dusty cocoon at a temperature of ∼450–475 K plus emission from the H Paα line. Between 3 and 6 years after the LRN onset, the SST light curves of AT 2011kp were declining in luminosity without becoming redder, as one would expect from a cooling object. However, the BB radius remained roughly constant, while the BB temperature decreased as T ∝ t−1/2, which are signatures of an IR echo propagating outwards through a dusty shell. After more than six years, the dusty circumstellar shell had likely fragmented in a similar way as directly observed for V838 Mon through resolved HST images only a few months after the event (Bond et al. 2003). This fragmentation allowed us to peer through the CSM and see the product of the merger. At these very late epochs, the IR echo started to disappear, while the dust shell cooled further. Therefore, in the next decades, only the central merger will remain observable, with properties that are expected to be similar to those currently observed in AT 1997bs.
JWST detected AT 1997bs in the NIR domain nearly 30 years after its outburst, but no source has been detected in the MIR. Its SED points towards a surviving red and expanded star as the outcome of the common-envelope ejection and the subsequent binary coalescence. Dust was surely present and contributed to the IR emission in 2004, seven years after the outburst, but was no longer producing MIR emission at the time of the 2023–2024 observations, hence unveiling the surviving object. Another possibility is that in the 20 years since the SST observation, the dust might have cooled down to the point that it is now emitting in the far-IR, hence impeding us from detecting it. The most recent observations reveal the red survivor of AT 1997bs, whose luminosity remained constant in the F814W filter between 2014 and 2023, supporting the idea of a fragmented CSM as seen in V838 Mon (Bond et al. 2003).
The remnant of AT 2019zhd, a LRN from a lower mass progenitor, is also compatible with a very cool and inflated red supergiant, similar to that found for OGLE-2002-BLG-360 (Steinmetz et al. 2025). Therefore, three LRNe were observed to end up as such up to now.
In conclusion, LRNe remain bright and visible in the MIR for years after coalescence due to persistent emission from newly formed dust. From their IR SEDs, we inferred dust masses of the order of 10−4 M⊙. Lastly, long after the merger, a cool and expanded remnant becomes discernible, similar to a red giant or supergiant star, demonstrating that these transients are not terminal events.
Data availability
All data analysed in this paper are publicly available through dedicated databases, such as IRSA and MAST, and can be obtained from https://dx.doi.org/10.17909/ky92-0c89. All the photometric measurements are tabulated in the photometry tables are available at the CDS via https://cdsarc.cds.unistra.fr/viz-bin/cat/J/A+A/706/A154.
Acknowledgments
We thank the anonymous referee for the constructive comments which helped to improve the quality of the manuscript. AR acknowledges financial support from the GRAWITA Large Program Grant (PI P. D’Avanzo). AR, AP, GV acknowledge financial support from the PRIN-INAF 2022 ‘Shedding light on the nature of gap transients: from the observations to the models’. This work is based on observations made with the NASA/ESA/CSA James Webb Space Telescope. The data were obtained from the Mikulski Archive for Space Telescopes at the Space Telescope Science Institute, which is operated by the Association of Universities for Research in Astronomy, Inc., under NASA contract NAS 5-03127. These observations are associated with programs ID 1783, 2107, 4793. This research is based on observations made with the NASA/ESA Hubble Space Telescope obtained from the Space Telescope Science Institute, which is operated by the Association of Universities for Research in Astronomy, Inc., under NASA contract NAS 5–26555. These observations are associated with programs ID 13364, 13442, 13773, 14668, 15645, 16239, 16800, 16801, 17070. This work is based in part on observations made with the Spitzer Space Telescope, which was operated by the Jet Propulsion Laboratory, California Institute of Technology under a contract with NASA. This publication makes use of data products from NEOWISE, which is a joint project of the Jet Propulsion Laboratory/California Institute of Technology and the University of Arizona. NEOWISE is funded by NASA.
References
- Adams, S. M., & Kochanek, C. S. 2015, MNRAS, 452, 2195 [Google Scholar]
- Baer-Way, R., DeGraw, A., Zheng, W., et al. 2024, ApJ, 964, 172 [NASA ADS] [CrossRef] [Google Scholar]
- Banerjee, D. P. K., Varricatt, W. P., Ashok, N. M., & Launila, O. 2003, ApJ, 598, L31 [NASA ADS] [CrossRef] [Google Scholar]
- Banerjee, D. P. K., Varricatt, W. P., & Ashok, N. M. 2004, ApJ, 615, L53 [NASA ADS] [CrossRef] [Google Scholar]
- Banerjee, D. P. K., Su, K. Y. L., Misselt, K. A., & Ashok, N. M. 2006, ApJ, 644, L57 [Google Scholar]
- Banerjee, D. P. K., Nuth, J. A., III, Misselt, K. A., et al. 2015, ApJ, 814, 109 [NASA ADS] [CrossRef] [Google Scholar]
- Berger, E., Soderberg, A. M., Chevalier, R. A., et al. 2009, ApJ, 699, 1850 [NASA ADS] [CrossRef] [Google Scholar]
- Bevan, A., & Barlow, M. J. 2016, MNRAS, 456, 1269 [NASA ADS] [CrossRef] [Google Scholar]
- Bevan, A. M., Krafton, K., Wesson, R., et al. 2020, ApJ, 894, 111 [NASA ADS] [CrossRef] [Google Scholar]
- Blagorodnova, N., Kotak, R., Polshaw, J., et al. 2017, ApJ, 834, 107 [NASA ADS] [CrossRef] [Google Scholar]
- Blagorodnova, N., Karambelkar, V., Adams, S. M., et al. 2020, MNRAS, 496, 5503 [CrossRef] [Google Scholar]
- Blagorodnova, N., Klencki, J., Pejcha, O., et al. 2021, A&A, 653, A134 [NASA ADS] [CrossRef] [EDP Sciences] [Google Scholar]
- Bond, H. E., Henden, A., Levay, Z. G., et al. 2003, Nature, 422, 405 [CrossRef] [Google Scholar]
- Bond, H. E., Mink, J., Doane, A., & Lavallee, S. 2022, AJ, 164, 28 [Google Scholar]
- Boschi, F., & Munari, U. 2004, A&A, 418, 869 [NASA ADS] [CrossRef] [EDP Sciences] [Google Scholar]
- Botticella, M. T., Pastorello, A., Smartt, S. J., et al. 2009, MNRAS, 398, 1041 [NASA ADS] [CrossRef] [Google Scholar]
- Cai, Y. Z., Pastorello, A., Fraser, M., et al. 2019, A&A, 632, L6 [NASA ADS] [CrossRef] [EDP Sciences] [Google Scholar]
- Cai, Y. Z., Pastorello, A., Fraser, M., et al. 2021, A&A, 654, A157 [NASA ADS] [CrossRef] [EDP Sciences] [Google Scholar]
- Cai, Y., Reguitti, A., Valerin, G., & Wang, X. 2022a, Universe, 8, 493 [NASA ADS] [CrossRef] [Google Scholar]
- Cai, Y. Z., Pastorello, A., Fraser, M., et al. 2022b, A&A, 667, A4 [Google Scholar]
- Castelli, F., & Kurucz, R. L. 2003, in Modelling of Stellar Atmospheres, eds. N. Piskunov, W. W. Weiss, & D. F. Gray, IAU Symp. 210, A20 [Google Scholar]
- Chamandy, L., Frank, A., Blackman, E. G., et al. 2018, MNRAS, 480, 1898 [NASA ADS] [CrossRef] [Google Scholar]
- Chambers, K. C., Magnier, E. A., Metcalfe, N., et al. 2016, arXiv e-prints [arXiv:1612.05560] [Google Scholar]
- Chen, Z., & Ivanova, N. 2024, ApJ, 963, L35 [NASA ADS] [CrossRef] [Google Scholar]
- Crause, L. A., Lawson, W. A., Menzies, J. W., & Marang, F. 2005, MNRAS, 358, 1352 [NASA ADS] [CrossRef] [Google Scholar]
- Cutri, R. M., Skrutskie, M. F., van Dyk, S., et al. 2003, 2MASS All Sky Catalog of point sources [Google Scholar]
- Cutri, R. M., Wright, E. L., Conrow, T., et al. 2012, Explanatory Supplement to the WISE All-Sky Data Release Products [Google Scholar]
- Dicken, D., Marín, M. G., Shivaei, I., et al. 2024, A&A, 689, A5 [NASA ADS] [CrossRef] [EDP Sciences] [Google Scholar]
- Draine, B. T., & Lee, H. M. 1984, ApJ, 285, 89 [NASA ADS] [CrossRef] [Google Scholar]
- Dwek, E. 1983, ApJ, 274, 175 [NASA ADS] [CrossRef] [Google Scholar]
- Exter, K. M., Cox, N. L. J., Swinyard, B. M., et al. 2016, A&A, 596, A96 [NASA ADS] [CrossRef] [EDP Sciences] [Google Scholar]
- Eyres, S. P. S., Bewsher, D., Hillman, Y., et al. 2017, MNRAS, 467, 2684 [Google Scholar]
- Eyres, S. P. S., Evans, A., Zijlstra, A., et al. 2018, MNRAS, 481, 4931 [NASA ADS] [Google Scholar]
- Fabbri, J., Otsuka, M., Barlow, M. J., et al. 2011, MNRAS, 418, 1285 [CrossRef] [Google Scholar]
- Fazio, G. G., Hora, J. L., Allen, L. E., et al. 2004, ApJS, 154, 10 [Google Scholar]
- Fraser, M., Kotak, R., Magill, L., Smartt, S. J., & Pastorello, A. 2011, ATel, 3574, 1 [Google Scholar]
- Gall, C., Hjorth, J., Watson, D., et al. 2014, Nature, 511, 326 [CrossRef] [Google Scholar]
- Gardner, J. P., Mather, J. C., Clampin, M., et al. 2006, Space Sci. Rev., 123, 485 [Google Scholar]
- Gehrz, R. D., Roellig, T. L., Werner, M. W., et al. 2007, Rev. Sci. Instrum., 78, 011302 [Google Scholar]
- González-Bolívar, M., De Marco, O., Bermúdez-Bustamante, L. C., Siess, L., & Price, D. J. 2024, MNRAS, 527, 9145 [Google Scholar]
- Goranskij, V. P., Barsukova, E. A., Spiridonova, O. I., et al. 2016, Astrophys. Bull., 71, 82 [NASA ADS] [CrossRef] [Google Scholar]
- Graham, J. R., & Meikle, W. P. S. 1986, MNRAS, 221, 789 [NASA ADS] [CrossRef] [Google Scholar]
- Guidolin, F., Pastorello, A., Stritzinger, M. D., et al. 2025, A&A, submitted [Google Scholar]
- Holtzman, J. A., Burrows, C. J., Casertano, S., et al. 1995, PASP, 107, 1065 [NASA ADS] [CrossRef] [Google Scholar]
- Howitt, G., Stevenson, S., Vigna-Gómez, A., et al. 2020, MNRAS, 492, 3229 [CrossRef] [Google Scholar]
- Humphreys, R. M., & Davidson, K. 1994, PASP, 106, 1025 [NASA ADS] [CrossRef] [Google Scholar]
- Husser, T. O., Wende-von Berg, S., Dreizler, S., et al. 2013, A&A, 553, A6 [NASA ADS] [CrossRef] [EDP Sciences] [Google Scholar]
- Iaconi, R., Maeda, K., De Marco, O., Nozawa, T., & Reichardt, T. 2019, MNRAS, 489, 3334 [NASA ADS] [CrossRef] [Google Scholar]
- Iaconi, R., Maeda, K., Nozawa, T., De Marco, O., & Reichardt, T. 2020, MNRAS, 497, 3166 [NASA ADS] [CrossRef] [Google Scholar]
- Ivanova, N., & Nandez, J. L. A. 2016, MNRAS, 462, 362 [NASA ADS] [CrossRef] [Google Scholar]
- Ivanova, N., Justham, S., Avendano Nandez, J. L., & Lombardi, J. C. 2013a, Science, 339, 433 [NASA ADS] [CrossRef] [Google Scholar]
- Ivanova, N., Justham, S., Chen, X., et al. 2013b, A&ARv, 21, 59 [Google Scholar]
- Ivezic, Z., & Elitzur, M. 1997, MNRAS, 287, 799 [Google Scholar]
- Ivezic, Z., Nenkova, M., & Elitzur, M. 1999a, DUSTY: Radiation transport in a dusty environment, Astrophysics Source Code Library [record ascl:9911.001] [Google Scholar]
- Ivezic, Z., Nenkova, M., & Elitzur, M. 1999b, arXiv e-prints [arXiv:astro-ph/9910475] [Google Scholar]
- Kamiński, T., Mason, E., Tylenda, R., & Schmidt, M. R. 2015, A&A, 580, A34 [NASA ADS] [CrossRef] [EDP Sciences] [Google Scholar]
- Kamiński, T., Steffen, W., Tylenda, R., et al. 2018, A&A, 617, A129 [NASA ADS] [CrossRef] [EDP Sciences] [Google Scholar]
- Kamiński, T., Menten, K. M., Tylenda, R., et al. 2020, A&A, 644, A59 [NASA ADS] [CrossRef] [EDP Sciences] [Google Scholar]
- Kamiński, T., Tylenda, R., Kiljan, A., et al. 2021, A&A, 655, A32 [NASA ADS] [CrossRef] [EDP Sciences] [Google Scholar]
- Kankare, E., Kotak, R., Pastorello, A., et al. 2015, A&A, 581, L4 [NASA ADS] [CrossRef] [EDP Sciences] [Google Scholar]
- Karambelkar, V., Kasliwal, M., Lau, R. M., et al. 2025, ApJ, submitted, [arXiv:2508.03932] [Google Scholar]
- Kato, T. 2003, A&A, 399, 695 [NASA ADS] [CrossRef] [EDP Sciences] [Google Scholar]
- Kimeswenger, S., Lederle, C., Schmeja, S., & Armsdorfer, B. 2002, MNRAS, 336, L43 [NASA ADS] [CrossRef] [Google Scholar]
- Kirilov, A., Calderón, D., Pejcha, O., & Duffell, P. C. 2025, ApJ, 994, L41 [Google Scholar]
- Kochanek, C. S. 2011, ApJ, 741, 37 [NASA ADS] [CrossRef] [Google Scholar]
- Kochanek, C. S., Khan, R., & Dai, X. 2012a, ApJ, 759, 20 [NASA ADS] [CrossRef] [Google Scholar]
- Kochanek, C. S., Szczygieł, D. M., & Stanek, K. Z. 2012b, ApJ, 758, 142 [NASA ADS] [CrossRef] [Google Scholar]
- Kochanek, C. S., Adams, S. M., & Belczynski, K. 2014, MNRAS, 443, 1319 [NASA ADS] [CrossRef] [Google Scholar]
- Kotak, R., Meikle, W. P. S., Farrah, D., et al. 2009, ApJ, 704, 306 [NASA ADS] [CrossRef] [Google Scholar]
- Kruckow, M. U., Tauris, T. M., Langer, N., et al. 2016, A&A, 596, A58 [NASA ADS] [CrossRef] [EDP Sciences] [Google Scholar]
- Kulkarni, S. R., Ofek, E. O., Rau, A., et al. 2007, Nature, 447, 458 [NASA ADS] [CrossRef] [Google Scholar]
- Kurtenkov, A. A., Pessev, P., Tomov, T., et al. 2015, A&A, 578, L10 [NASA ADS] [CrossRef] [EDP Sciences] [Google Scholar]
- Lau, R. M., Jencson, J. E., Salyk, C., et al. 2025, ApJ, 983, 87 [Google Scholar]
- Li, W., Filippenko, A. V., Van Dyk, S. D., et al. 2002, PASP, 114, 403 [Google Scholar]
- Lipunov, V. M., Blinnikov, S., Gorbovskoy, E., et al. 2017, MNRAS, 470, 2339 [NASA ADS] [CrossRef] [Google Scholar]
- MacLeod, M., Macias, P., Ramirez-Ruiz, E., et al. 2017, ApJ, 835, 282 [NASA ADS] [CrossRef] [Google Scholar]
- MacLeod, M., De, K., & Loeb, A. 2022, ApJ, 937, 96 [NASA ADS] [CrossRef] [Google Scholar]
- Mainzer, A., Bauer, J., Grav, T., et al. 2011, ApJ, 731, 53 [Google Scholar]
- Mainzer, A., Bauer, J., Cutri, R. M., et al. 2014, ApJ, 792, 30 [Google Scholar]
- Marini, E., Dell’Agli, F., Groenewegen, M. A. T., et al. 2021, A&A, 647, A69 [NASA ADS] [CrossRef] [EDP Sciences] [Google Scholar]
- Martini, P., Wagner, R. M., Tomaney, A., et al. 1999, AJ, 118, 1034 [NASA ADS] [CrossRef] [Google Scholar]
- Mason, E., & Shore, S. N. 2022, A&A, 664, A12 [NASA ADS] [CrossRef] [EDP Sciences] [Google Scholar]
- Mason, E., Diaz, M., Williams, R. E., Preston, G., & Bensby, T. 2010, A&A, 516, A108 [CrossRef] [EDP Sciences] [Google Scholar]
- Mathis, J. S., Rumpl, W., & Nordsieck, K. H. 1977, ApJ, 217, 425 [Google Scholar]
- Matsumoto, T., & Metzger, B. D. 2022, ApJ, 938, 5 [NASA ADS] [CrossRef] [Google Scholar]
- Mattila, S., Meikle, W. P. S., Lundqvist, P., et al. 2008, MNRAS, 389, 141 [NASA ADS] [CrossRef] [Google Scholar]
- Mauerhan, J. C., Van Dyk, S. D., Graham, M. L., et al. 2015, MNRAS, 447, 1922 [NASA ADS] [CrossRef] [Google Scholar]
- Mauerhan, J. C., Van Dyk, S. D., Johansson, J., et al. 2018, MNRAS, 473, 3765 [NASA ADS] [CrossRef] [Google Scholar]
- Maund, J. R., Smartt, S. J., Kudritzki, R. P., et al. 2006, MNRAS, 369, 390 [NASA ADS] [CrossRef] [Google Scholar]
- Mayall, M. W. 1949, AJ, 54, R191 [Google Scholar]
- McCollum, B., Laine, S., Väisänen, P., et al. 2014, AJ, 147, 11 [Google Scholar]
- Meikle, W. P. S., Mattila, S., Gerardy, C. L., et al. 2006, ApJ, 649, 332 [CrossRef] [Google Scholar]
- Meikle, W. P. S., Kotak, R., Farrah, D., et al. 2011, ApJ, 732, 109 [Google Scholar]
- Metzger, B. D., & Pejcha, O. 2017, MNRAS, 471, 3200 [NASA ADS] [CrossRef] [Google Scholar]
- Mould, J., Cohen, J., Graham, J. R., et al. 1990, ApJ, 353, L35 [NASA ADS] [CrossRef] [Google Scholar]
- Munari, U., Henden, A., Kiyota, S., et al. 2002, A&A, 389, L51 [NASA ADS] [CrossRef] [EDP Sciences] [Google Scholar]
- Nandez, J. L. A., Ivanova, N., & Lombardi, J. C., Jr 2014, ApJ, 786, 39 [NASA ADS] [CrossRef] [Google Scholar]
- Nicholls, C. P., Melis, C., Soszynski, I., et al. 2013, MNRAS, 431, L33 [NASA ADS] [CrossRef] [Google Scholar]
- Ohlmann, S. T., Röpke, F. K., Pakmor, R., & Springel, V. 2016, ApJ, 816, L9 [Google Scholar]
- Ohsawa, R., Sakon, I., Onaka, T., et al. 2010, ApJ, 718, 1456 [NASA ADS] [CrossRef] [Google Scholar]
- Oke, J. B., & Gunn, J. E. 1983, ApJ, 266, 713 [NASA ADS] [CrossRef] [Google Scholar]
- Pastorello, A., & Fraser, M. 2019, Nat. Astron., 3, 676 [Google Scholar]
- Pastorello, A., Chen, T. W., Cai, Y. Z., et al. 2019a, A&A, 625, L8 [NASA ADS] [CrossRef] [EDP Sciences] [Google Scholar]
- Pastorello, A., Mason, E., Taubenberger, S., et al. 2019b, A&A, 630, A75 [NASA ADS] [CrossRef] [EDP Sciences] [Google Scholar]
- Pastorello, A., Fraser, M., Valerin, G., et al. 2021a, A&A, 646, A119 [EDP Sciences] [Google Scholar]
- Pastorello, A., Valerin, G., Fraser, M., et al. 2021b, A&A, 647, A93 [NASA ADS] [CrossRef] [EDP Sciences] [Google Scholar]
- Pastorello, A., Valerin, G., Fraser, M., et al. 2023, A&A, 671, A158 [NASA ADS] [CrossRef] [EDP Sciences] [Google Scholar]
- Pejcha, O. 2014, ApJ, 788, 22 [NASA ADS] [CrossRef] [Google Scholar]
- Pejcha, O., Metzger, B. D., & Tomida, K. 2016, MNRAS, 455, 4351 [Google Scholar]
- Prieto, J. L., Sellgren, K., Thompson, T. A., & Kochanek, C. S. 2009, ApJ, 705, 1425 [NASA ADS] [CrossRef] [Google Scholar]
- Prust, L. J., & Chang, P. 2019, MNRAS, 486, 5809 [NASA ADS] [CrossRef] [Google Scholar]
- Reichardt, T. A., De Marco, O., Iaconi, R., Tout, C. A., & Price, D. J. 2019, MNRAS, 484, 631 [NASA ADS] [CrossRef] [Google Scholar]
- Rieke, M. J., Kelly, D. M., Misselt, K., et al. 2023, PASP, 135, 028001 [CrossRef] [Google Scholar]
- Sand, C., Ohlmann, S. T., Schneider, F. R. N., Pakmor, R., & Röpke, F. K. 2020, A&A, 644, A60 [NASA ADS] [CrossRef] [EDP Sciences] [Google Scholar]
- Sarangi, A., Zsíros, S., Szalai, T., et al. 2025, ApJ, 993, 94 [Google Scholar]
- Schneider, F. R. N., Podsiadlowski, P., & Laplace, E. 2024, A&A, 686, A45 [NASA ADS] [CrossRef] [EDP Sciences] [Google Scholar]
- Shara, M. M., Moffat, A. F. J., & Webbink, R. F. 1985, ApJ, 294, 271 [NASA ADS] [CrossRef] [Google Scholar]
- Sirianni, M., Jee, M. J., Benítez, N., et al. 2005, PASP, 117, 1049 [Google Scholar]
- Smith, N. 2017, in Handbook of Supernovae, eds. A. W. Alsabti, & P. Murdin, 403 [Google Scholar]
- Smith, N., Li, W., Silverman, J. M., Ganeshalingam, M., & Filippenko, A. V. 2011, MNRAS, 415, 773 [NASA ADS] [CrossRef] [Google Scholar]
- Smith, N., Andrews, J. E., Van Dyk, S. D., et al. 2016, MNRAS, 458, 950 [Google Scholar]
- Steinmetz, T., Kamiński, T., Melis, C., et al. 2025, A&A, 699, A316 [NASA ADS] [CrossRef] [EDP Sciences] [Google Scholar]
- Szalai, T., Fox, O. D., Arendt, R. G., et al. 2021, ApJ, 919, 17 [NASA ADS] [CrossRef] [Google Scholar]
- Tartaglia, L., Pastorello, A., Benetti, S., et al. 2015a, ATel, 7051, 1 [Google Scholar]
- Tartaglia, L., Pastorello, A., Taubenberger, S., et al. 2015b, MNRAS, 447, 117 [NASA ADS] [CrossRef] [Google Scholar]
- Tartaglia, L., Elias-Rosa, N., Pastorello, A., et al. 2016, ApJ, 823, L23 [NASA ADS] [CrossRef] [Google Scholar]
- Tinyanont, S., Fox, O. D., Shahbandeh, M., et al. 2025, ApJ, 985, 198 [Google Scholar]
- Tylenda, R. 2005, A&A, 436, 1009 [NASA ADS] [CrossRef] [EDP Sciences] [Google Scholar]
- Tylenda, R., & Kamiński, T. 2016, A&A, 592, A134 [NASA ADS] [CrossRef] [EDP Sciences] [Google Scholar]
- Tylenda, R., Crause, L. A., Górny, S. K., & Schmidt, M. R. 2005, A&A, 439, 651 [NASA ADS] [CrossRef] [EDP Sciences] [Google Scholar]
- Tylenda, R., Hajduk, M., Kamiński, T., et al. 2011, A&A, 528, A114 [NASA ADS] [CrossRef] [EDP Sciences] [Google Scholar]
- Tylenda, R., Kamiński, T., Udalski, A., et al. 2013, A&A, 555, A16 [NASA ADS] [CrossRef] [EDP Sciences] [Google Scholar]
- Tylenda, R., Kamiński, T., & Smolec, R. 2024, A&A, 685, A49 [NASA ADS] [CrossRef] [EDP Sciences] [Google Scholar]
- Valerin, G., Pastorello, A., Reguitti, A., et al. 2025, A&A, 695, A42 [NASA ADS] [CrossRef] [EDP Sciences] [Google Scholar]
- Van Dyk, S. D., & Matheson, T. 2012, ApJ, 746, 179 [NASA ADS] [CrossRef] [Google Scholar]
- Van Dyk, S. D., Peng, C. Y., Barth, A. J., & Filippenko, A. V. 1999, AJ, 118, 2331 [NASA ADS] [CrossRef] [Google Scholar]
- Van Dyk, S. D., Peng, C. Y., King, J. Y., et al. 2000, PASP, 112, 1532 [NASA ADS] [CrossRef] [Google Scholar]
- Werner, M. W., Roellig, T. L., Low, F. J., et al. 2004, ApJS, 154, 1 [NASA ADS] [CrossRef] [Google Scholar]
- Williams, S. C., Darnley, M. J., Bode, M. F., & Steele, I. A. 2015, ApJ, 805, L18 [Google Scholar]
- Wisniewski, J. P., Clampin, M., Bjorkman, K. S., & Barry, R. K. 2008, ApJ, 683, L171 [NASA ADS] [CrossRef] [Google Scholar]
- Wright, E. L., Eisenhardt, P. R. M., Mainzer, A. K., et al. 2010, AJ, 140, 1868 [Google Scholar]
- Zubko, V. G., Mennella, V., Colangeli, L., & Bussoletti, E. 1996, MNRAS, 282, 1321 [Google Scholar]
but see Eyres et al. (2018), Tylenda et al. (2024).
ecsnoopy is a package for SN photometry using PSF fitting and/or template subtraction developed by E. Cappellaro. A package description can be found at https://sngroup.oapd.inaf.it/ecsnoopy.html.
Including Ch3 and Ch4, indicated as [5.8] and [8.0] because their central wavelengths are expressed in μm.
Alternative designations used in the literature for AT 2011kp are NGC4490-2011OT1 and NGC4490-OT2011.
The mass was estimated from a comparison of the location of the progenitor within the HRD to some evolutionary tracks.
The object is also reported in the literature as M101-2015OT1 and M101 OT2015-1 (e.g., Goranskij et al. 2016).
Retrieved here: https://archive.stsci.edu/hlsps/reference-atlases/cdbs/grid/ck04models/
We warn that these parameters are obtained after correcting for a reddening of only E(B − V) = 0.04 mag. We cannot exclude, given the earlier observations, that a significant amount of dust is still present and can obscure the merger, making it redder and fainter.
retrieved here: https://pollux.graal.univ-montp2.fr/collections/
We should also account that JWST observations are not affected by the strong telluric absorption bands that usually suppress the Paschen α emission in ground-based telescope observations (e.g., Blagorodnova et al. 2021; Pastorello et al. 2023).
Appendix A: Additional plots
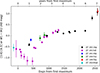 |
Fig. A.1. Mid-infrared [3.6]-[4.5] or W1 − W2 colour curves of AT 2011kp, AT 2015dl, AT 2013lw, AT 2007sv, AT 1997bs, AT 2020hat between 5 months before and 7 years after their respective first maximum. The objects show a remarkably similar evolution. |
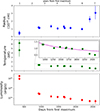 |
Fig. A.2. Evolution of the BB radius (top), temperature (middle) and the bolometric luminosity (bottom) of AT 2011kp, estimated through a fit of a Planckian function on the SST Ch1 and Ch2 data. In the middle panel, the late-time temperature evolution is zoomed-in, together with the best-fit At−0.5 function on the data between +2 and +6 years, showing a good match. |
Appendix B: DUSTY best-fit models determination
In order to identify the DUSTY model that best fits our observations, we constructed a grid of models in subsequent steps. Firstly, once fixed the temperature of the central source (Ts), the density profile of the dust (k) and the relative width of the dust shell (Y), we also fixed the dust temperature at the inner radius (Td) and produced 21 DUSTY models with optical depths in the V-band (τV) spanning from 0 to 100 with a step of five. When necessary, for example with some silicate dust configurations, we extended the grid to larger optical depths (typically up to 200). We introduced a multiplicative factor as a free parameter to scale each model to the observations (physically, this is a proxy for the dust radius, which is not needed for generating DUSTY models), obtaining a χ2 value for each model. We then refined the grid around the model with the minimum value of χ2, generating an additional set of 21 DUSTY models with optical depth τV centred on the value of τV providing the best χ2, this time with a step of 0.5. Again, thanks to the free multiplicative parameter we are able to fit the models to the observations and determine which τV provides the best results for that specific set of parameters. An example of the resulting χ2 and normalised likelihoods for the specific case of Ts = 3500 K, Td = 450 K, k = 2, Y = 2 and AMC composition can be seen in Figure B.1. In the lower panel, the likelihood is calculated from the χ2 value as
 (B.1)
(B.1)
and we normalised it so that its integral over the considered interval is equal to one. By fitting a Gaussian function to the likelihood values, we are able to associate an uncertainty to τV of the best model for each set of input parameters, by taking its standard deviation σ.
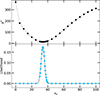 |
Fig. B.1. Plot of χ2 and normalised likelihood for 42 DUSTY models generated with the same initial parameters while only varying the optical depth τV. |
We then repeated this process for a set of inner dust temperatures Td, initially with a step of 100 K, and then refined the grid with steps of 50 K (and for AT 2011kp down to 25 K) around the best solution found. In Figure B.2 we display the best models obtained, resulting from minimising the χ2 of 42 models with varying τV for each Td considered. The fixed parameters for the models shown in Figure B.2 are Ts = 3500 K, k = 2, Y = 2 and AMC composition. By observing the distribution of χ2 and likelihood, it is clear that there is a preferred inner dust temperature for these fixed parameters, which is therefore selected as the best model for this given configuration. The last three panels of Figure B.2 show the variations of the optical depth in the V-band τV, dust radius, source radius, and dust mass for the best models at each considered value of Td. All the steps described above were repeated for a composition of pure silicates and, in the case of AT 2011kp, also for a mixture of silicates and AMC.
In order to explore the effects of changing the properties of the central source, we also performed the procedure described above increasing the temperature of the central star to 7000 K. We find that similar models are obtained in terms of quality of the fits with limited changes to the dust temperature (∼20%); however, especially for AMC models, the dust radius tends to increase with increasing temperature of the central source (up to a factor of two), as the optical depth diminishes, with competing effects on the dust mass, which indeed is not strongly affected by the changes of the central source. The parameter most affected is the radius of the central source, which shrinks significantly. In the considered cases, with the available data, it is challenging to securely infer the properties of the central source from the observed data.
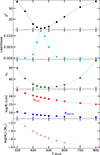 |
Fig. B.2. Parameters of the best models against each considered dust temperature Td. From top to bottom panels: χ2 and likelihood parameters, optical depth τV, dust and source radii, and dust mass. |
All Tables
All Figures
|
Fig. 1. Very late time detections of AT 1997bs. Top-left: Detection of AT 1997bs in an SST Ch2 filter image obtained in 2004 (after the subtraction of a template image). Top-right: Same, but for the Ch4 filter (using a JWST/MIRI F770W image as a template). The green circles are centred at the transient position and has a radius of 5″. Bottom-left: Detection of AT 1997bs in F814W filter in HST/ACS images obtained in 2023. Bottom-right: Detection of AT 1997bs in F150W-filter JWST/NIRCam images obtained in 2023. The green circle are centred at the position of the transient and have a radius of 0.15″. |
| In the text | |
|
Fig. 2. Detection of AT 2007sv in 2010 images obtained by SST in the Ch1 (left) and Ch2 (right) filters. The green circles are centred at the transient position and have a radius of 3″. |
| In the text | |
|
Fig. 3. Images from HST of the field of AT 2011kp. Left: F814W filter image obtained on 2013 October 30. Centre: F814W filter image taken on 2014 January 12. Right: F657N HST image obtained on 2014 October 23. The green circles are centred at the coordinates of the transient and have a radius of 0.5″. |
| In the text | |
|
Fig. 4. Mid-infrared light curve of AT 2011kp spanning 12.5 years of evolution. The 2024 JWST/NIRCam F444W filter measurement is also shown as its bandpass is similar to that of the Ch2 filter. Upper limits are marked with downwards arrows. For reference, the r-band light curve published by Pastorello et al. (2019b) is also shown with green squares. |
| In the text | |
|
Fig. 5. JWST MIRI and NIRCam images of AT 2011kp. Panels are as follow: (a): F770W, (b): F560W, (c): F444W, (d): F335M, (e): F187N, and (f): F115W. In the MIR, a bright source is clearly visible 12.5 years after the first peak. In the top row stamps, the green circles are centred at the position of the transient and have a radius of 0.5″. In the F335M stamp, the circle has a radius of 0.3″, while in the F187N and F115W stamps it has a radius of 0.1″. The latter two stamps are more zoomed-in to better identify the counterpart. |
| In the text | |
|
Fig. 6. Detection of AT 2013lw in the template-subtracted 2014 images obtained by SST in the Ch1 (left) and Ch2 (right) filters. The green circles are centred at the transient position and have a radius of 3″. |
| In the text | |
|
Fig. 7. Possible detection of AT 2015fx by HST/WFC3 in the F814W filter in 2016. The green circle is centred at the transient position and has a radius of 0.2″. |
| In the text | |
|
Fig. 8. Mid-infrared SST and WISE light curves of AT 2015dl spanning over 4.5 years of evolution. A K-band upper limit from UKIRT/WFCAM is also shown. Downwards arrows mark the upper limits. For reference, the r-band light curve published by Blagorodnova et al. (2017) is also shown with magenta squares. |
| In the text | |
|
Fig. 9. AT 2015dl in the SST image obtained on 2019 August 2. Despite being imaged at the edge of the frame, the source is still detectable. The green circle, centred at the transient position, has a radius of 3″. |
| In the text | |
|
Fig. 10. HST/WFC3 image of the field of AT 2018bwo taken with the F350LP filter on 2022 October 1. The green circle is centred at the transient position and has a radius of 0.2″. |
| In the text | |
|
Fig. 11. HST/ACS images taken in 2022 of the field of AT 2019zhd. Left: Detection in the F814W filter. Right: Detection in the F475W filter. The green circles are centred at the transient position and have a radius of 0.31″. The three sources identified by Pastorello et al. (2021a) are also labelled. Notably, none of them match the position of AT 2019zhd. |
| In the text | |
|
Fig. 12. Mid-infrared light curve of AT 2020hat before (from SST) and during (from WISE) the outburst. Downwards triangles mark upper limits. For reference, the r-band light curve from Pastorello et al. (2021b) is also shown with green squares. |
| In the text | |
|
Fig. 13. Detection of AT 2020hat in the MIR template-subtracted images. Left: Last Ch1 observation from SST (on 2019 November 21). Right: WISE W1 observation performed on 2020 June 24. The green circles are centred at the transient position and have radii of 3″ and 10″, respectively. |
| In the text | |
|
Fig. 14. Spectral energy distributions of AT 1997bs. Top panel: SED ∼27 years after the outburst from HST/ACS and JWST/NIRCam observations. The SED is compared to ATLAS9 stellar atmospheric models from Castelli & Kurucz (2003). Good matches are found with models with temperatures between 3750 and 4250 K, and radii between 150 and 120 R⊙. Middle panel: SED at the time of the 2004 SST observations. This cooler SED is fitted with a DUSTY model with a 100% silicate composition, a dust temperature of Td = 600 K, a source temperature of Ts = 4000 K, and an optical depth of τV = 68.5. Bottom panel: Same but for a model with a 100% AMC composition and optical depth of τV = 16. |
| In the text | |
|
Fig. 15. Spectral energy distribution of the remnant of AT 2019zhd compared to PHOENIX stellar atmospheric models from Husser et al. (2013). The PHOENIX spectra have been convolved with a Gaussian kernel with a width of 20 Å. Matches are found with models with temperatures of 3000 and 3200 K, and radii of 400 and 300 R⊙. |
| In the text | |
|
Fig. 16. Spectral energy distribution of AT 2011kp as obtained from JWST observations performed in 2023 and 2024 (13 years after the LRN onset), from 1.15 to 7.7 μm (black points). Downwards arrows mark upper limits. The SED is best-fitted with three DUSTY models with different chemical compositions: 100% silicates (top panel), 50% silicates + 50% AMC (middle panel), and 100% AMC (bottom panel). Contributions from dust emission, attenuated, and scattered light are also shown. The excess at 1.8 μm is marked with a rhombus. |
| In the text | |
|
Fig. A.1. Mid-infrared [3.6]-[4.5] or W1 − W2 colour curves of AT 2011kp, AT 2015dl, AT 2013lw, AT 2007sv, AT 1997bs, AT 2020hat between 5 months before and 7 years after their respective first maximum. The objects show a remarkably similar evolution. |
| In the text | |
|
Fig. A.2. Evolution of the BB radius (top), temperature (middle) and the bolometric luminosity (bottom) of AT 2011kp, estimated through a fit of a Planckian function on the SST Ch1 and Ch2 data. In the middle panel, the late-time temperature evolution is zoomed-in, together with the best-fit At−0.5 function on the data between +2 and +6 years, showing a good match. |
| In the text | |
|
Fig. B.1. Plot of χ2 and normalised likelihood for 42 DUSTY models generated with the same initial parameters while only varying the optical depth τV. |
| In the text | |
|
Fig. B.2. Parameters of the best models against each considered dust temperature Td. From top to bottom panels: χ2 and likelihood parameters, optical depth τV, dust and source radii, and dust mass. |
| In the text | |
Current usage metrics show cumulative count of Article Views (full-text article views including HTML views, PDF and ePub downloads, according to the available data) and Abstracts Views on Vision4Press platform.
Data correspond to usage on the plateform after 2015. The current usage metrics is available 48-96 hours after online publication and is updated daily on week days.
Initial download of the metrics may take a while.