Open Access
Fig. A.1.
Download original image
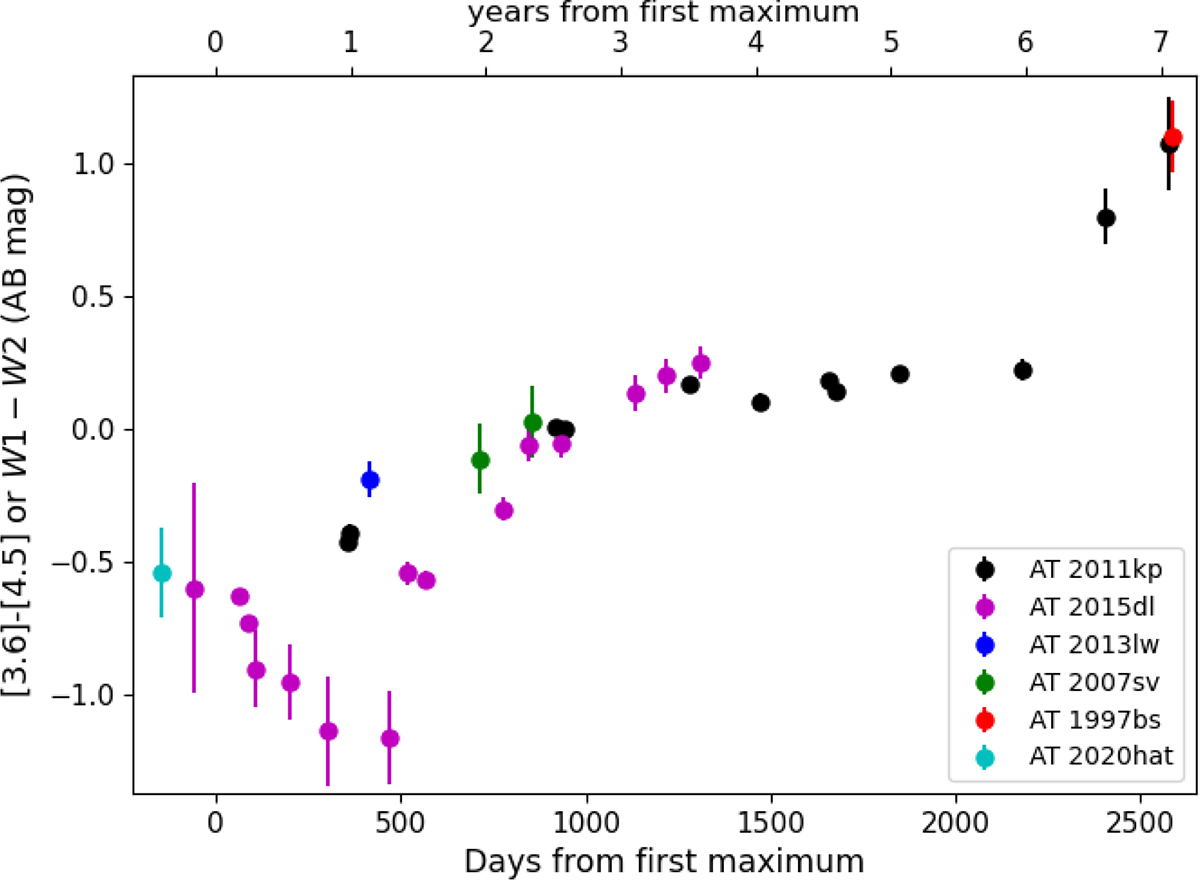
Mid-infrared [3.6]-[4.5] or W1 − W2 colour curves of AT 2011kp, AT 2015dl, AT 2013lw, AT 2007sv, AT 1997bs, AT 2020hat between 5 months before and 7 years after their respective first maximum. The objects show a remarkably similar evolution.
Current usage metrics show cumulative count of Article Views (full-text article views including HTML views, PDF and ePub downloads, according to the available data) and Abstracts Views on Vision4Press platform.
Data correspond to usage on the plateform after 2015. The current usage metrics is available 48-96 hours after online publication and is updated daily on week days.
Initial download of the metrics may take a while.