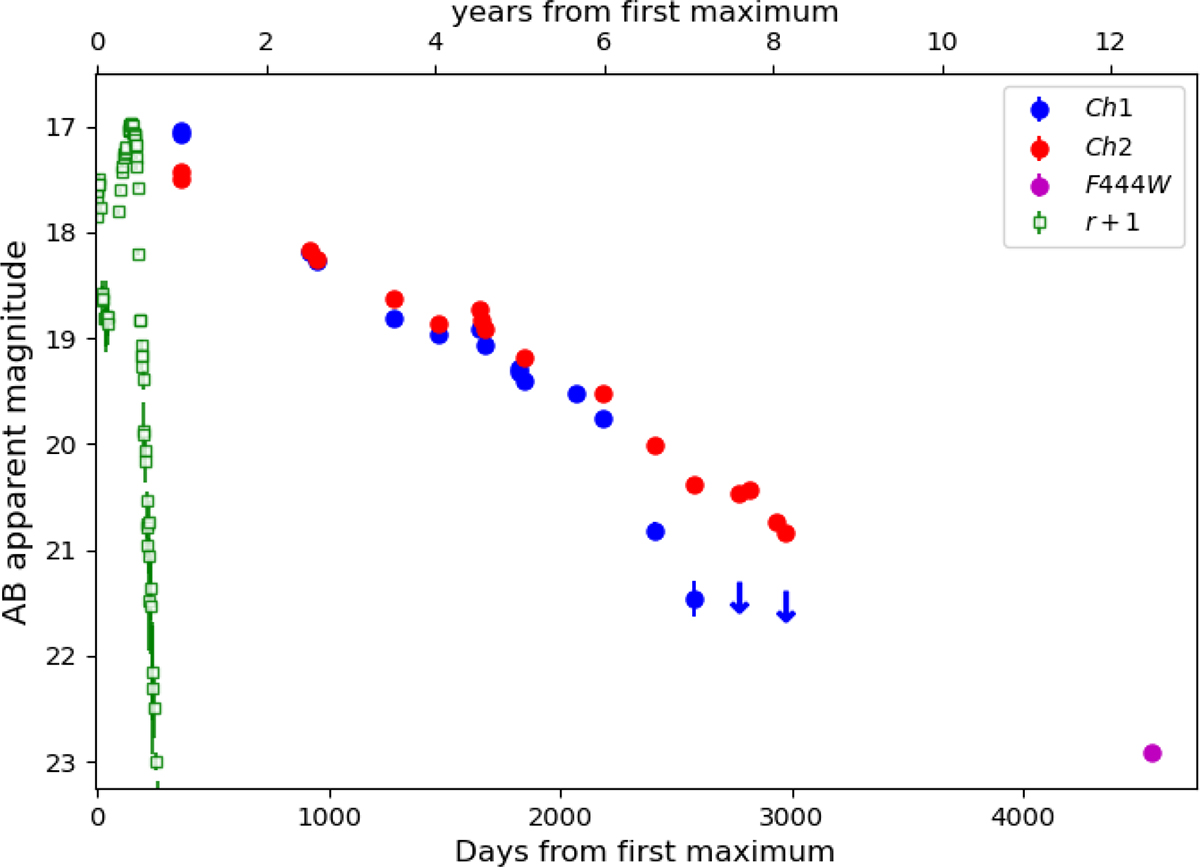
Fig. 4.
Download original image
Mid-infrared light curve of AT 2011kp spanning 12.5 years of evolution. The 2024 JWST/NIRCam F444W filter measurement is also shown as its bandpass is similar to that of the Ch2 filter. Upper limits are marked with downwards arrows. For reference, the r-band light curve published by Pastorello et al. (2019b) is also shown with green squares.
Current usage metrics show cumulative count of Article Views (full-text article views including HTML views, PDF and ePub downloads, according to the available data) and Abstracts Views on Vision4Press platform.
Data correspond to usage on the plateform after 2015. The current usage metrics is available 48-96 hours after online publication and is updated daily on week days.
Initial download of the metrics may take a while.