Open Access
Fig. 8.
Download original image
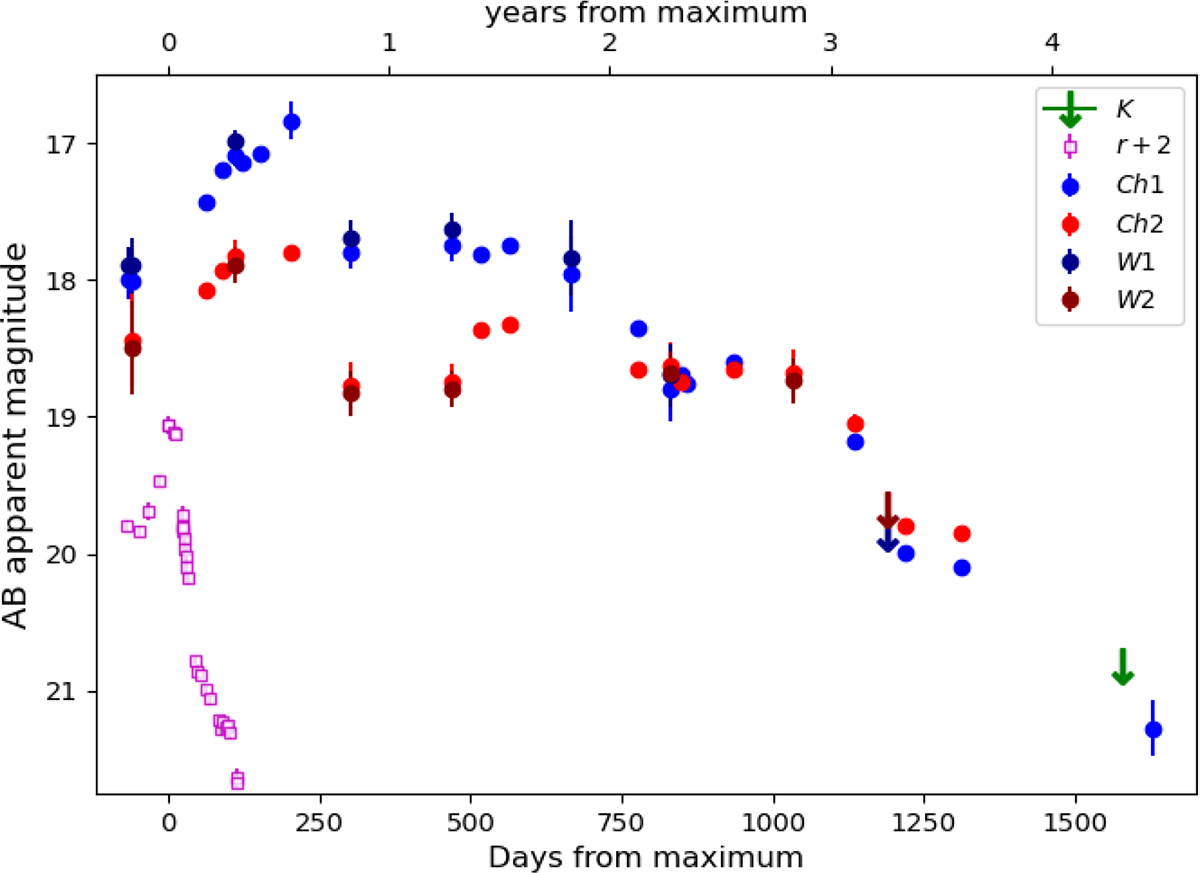
Mid-infrared SST and WISE light curves of AT 2015dl spanning over 4.5 years of evolution. A K-band upper limit from UKIRT/WFCAM is also shown. Downwards arrows mark the upper limits. For reference, the r-band light curve published by Blagorodnova et al. (2017) is also shown with magenta squares.
Current usage metrics show cumulative count of Article Views (full-text article views including HTML views, PDF and ePub downloads, according to the available data) and Abstracts Views on Vision4Press platform.
Data correspond to usage on the plateform after 2015. The current usage metrics is available 48-96 hours after online publication and is updated daily on week days.
Initial download of the metrics may take a while.