Fig. 1
Download original image
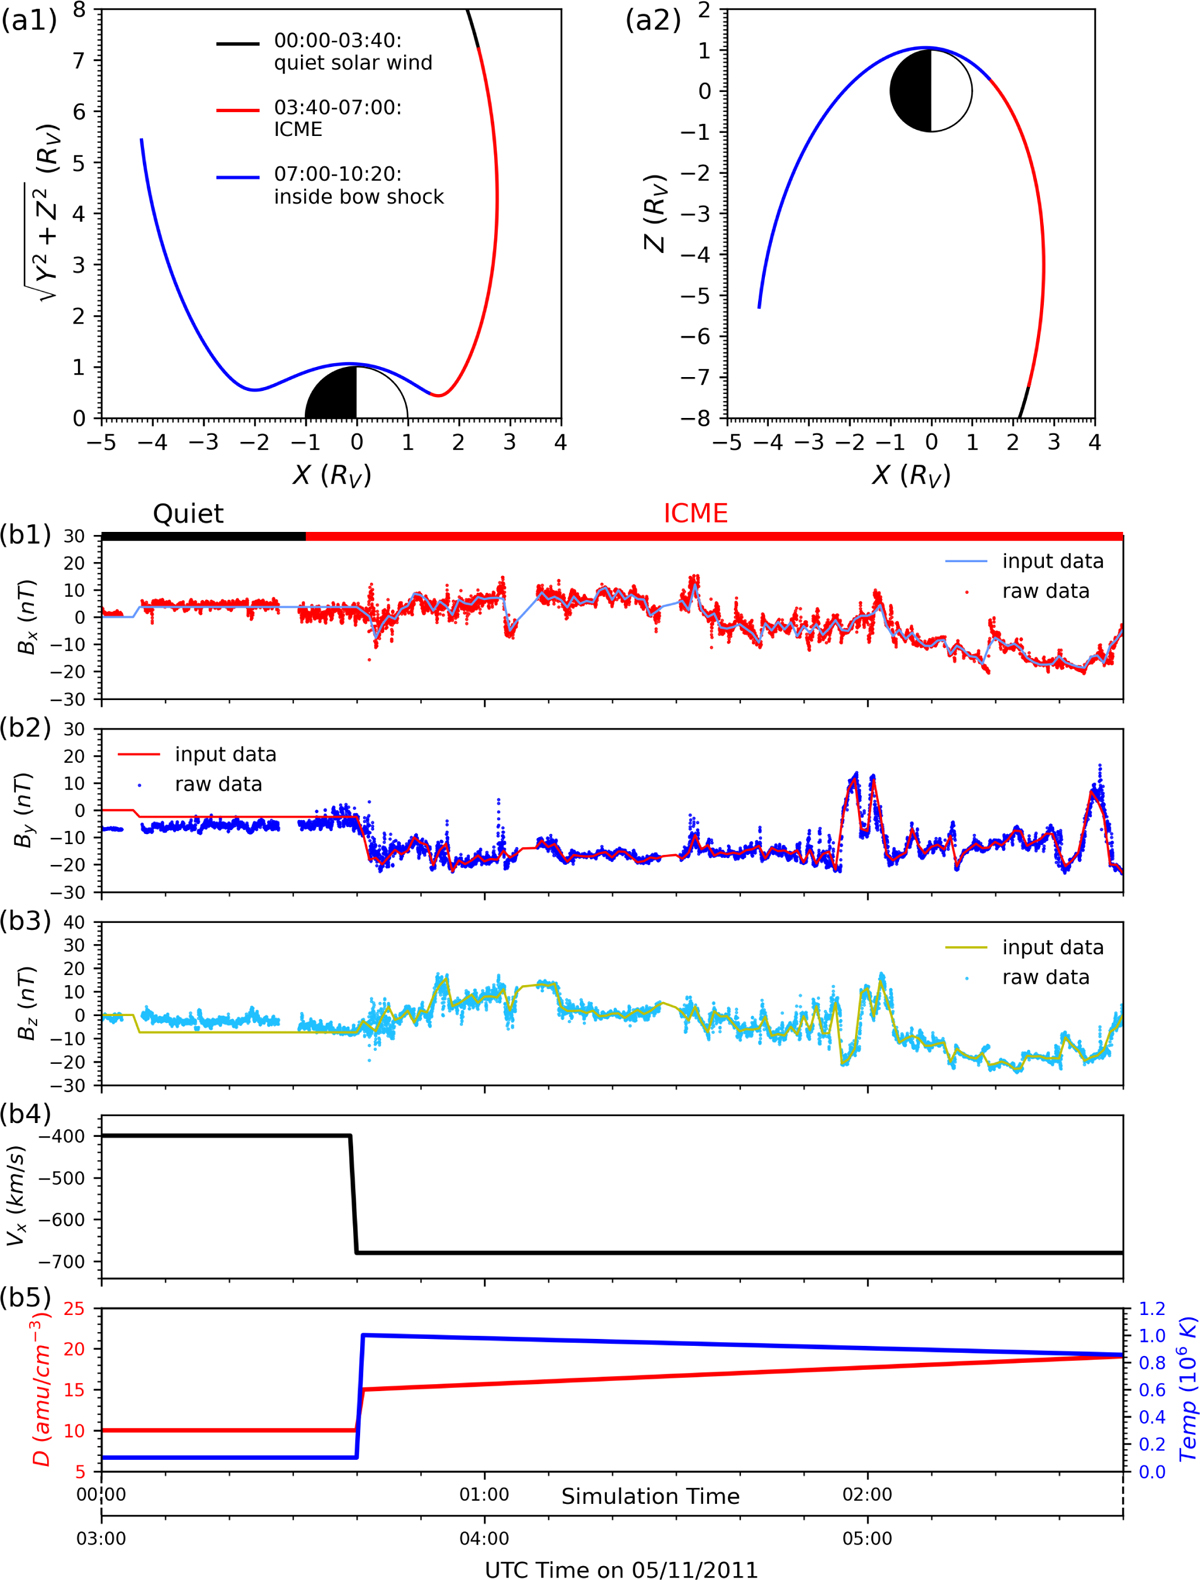
Top panels (a1, a2) show the orbit of VEX on 5 November 2011 in cylindrical coordinates X and ![]() (a1) and X-Z plane (a2), respectively. The legend gives the UTC time for the segments of the VEX trajectory, with different line colors representing different intervals during the orbital period. Panels (b1–b5) are the upstream solar wind driving used to drive the simulations. Panels (b1–b3) present the input magnetic field components (solid lines), obtained through interpolation of the VEX data (scatters). Panels (b4, b5) illustrate the idealized ICME plasma parameters including the velocity, temperature, and density of solar wind. Upon the arrival of the ICME, there are enhanced pulses in velocity, temperature, and density; the velocity remains steady afterward, while the temperature gradually decreases, and the density continues to increase.
(a1) and X-Z plane (a2), respectively. The legend gives the UTC time for the segments of the VEX trajectory, with different line colors representing different intervals during the orbital period. Panels (b1–b5) are the upstream solar wind driving used to drive the simulations. Panels (b1–b3) present the input magnetic field components (solid lines), obtained through interpolation of the VEX data (scatters). Panels (b4, b5) illustrate the idealized ICME plasma parameters including the velocity, temperature, and density of solar wind. Upon the arrival of the ICME, there are enhanced pulses in velocity, temperature, and density; the velocity remains steady afterward, while the temperature gradually decreases, and the density continues to increase.
Current usage metrics show cumulative count of Article Views (full-text article views including HTML views, PDF and ePub downloads, according to the available data) and Abstracts Views on Vision4Press platform.
Data correspond to usage on the plateform after 2015. The current usage metrics is available 48-96 hours after online publication and is updated daily on week days.
Initial download of the metrics may take a while.