Open Access
Fig. 2
Download original image
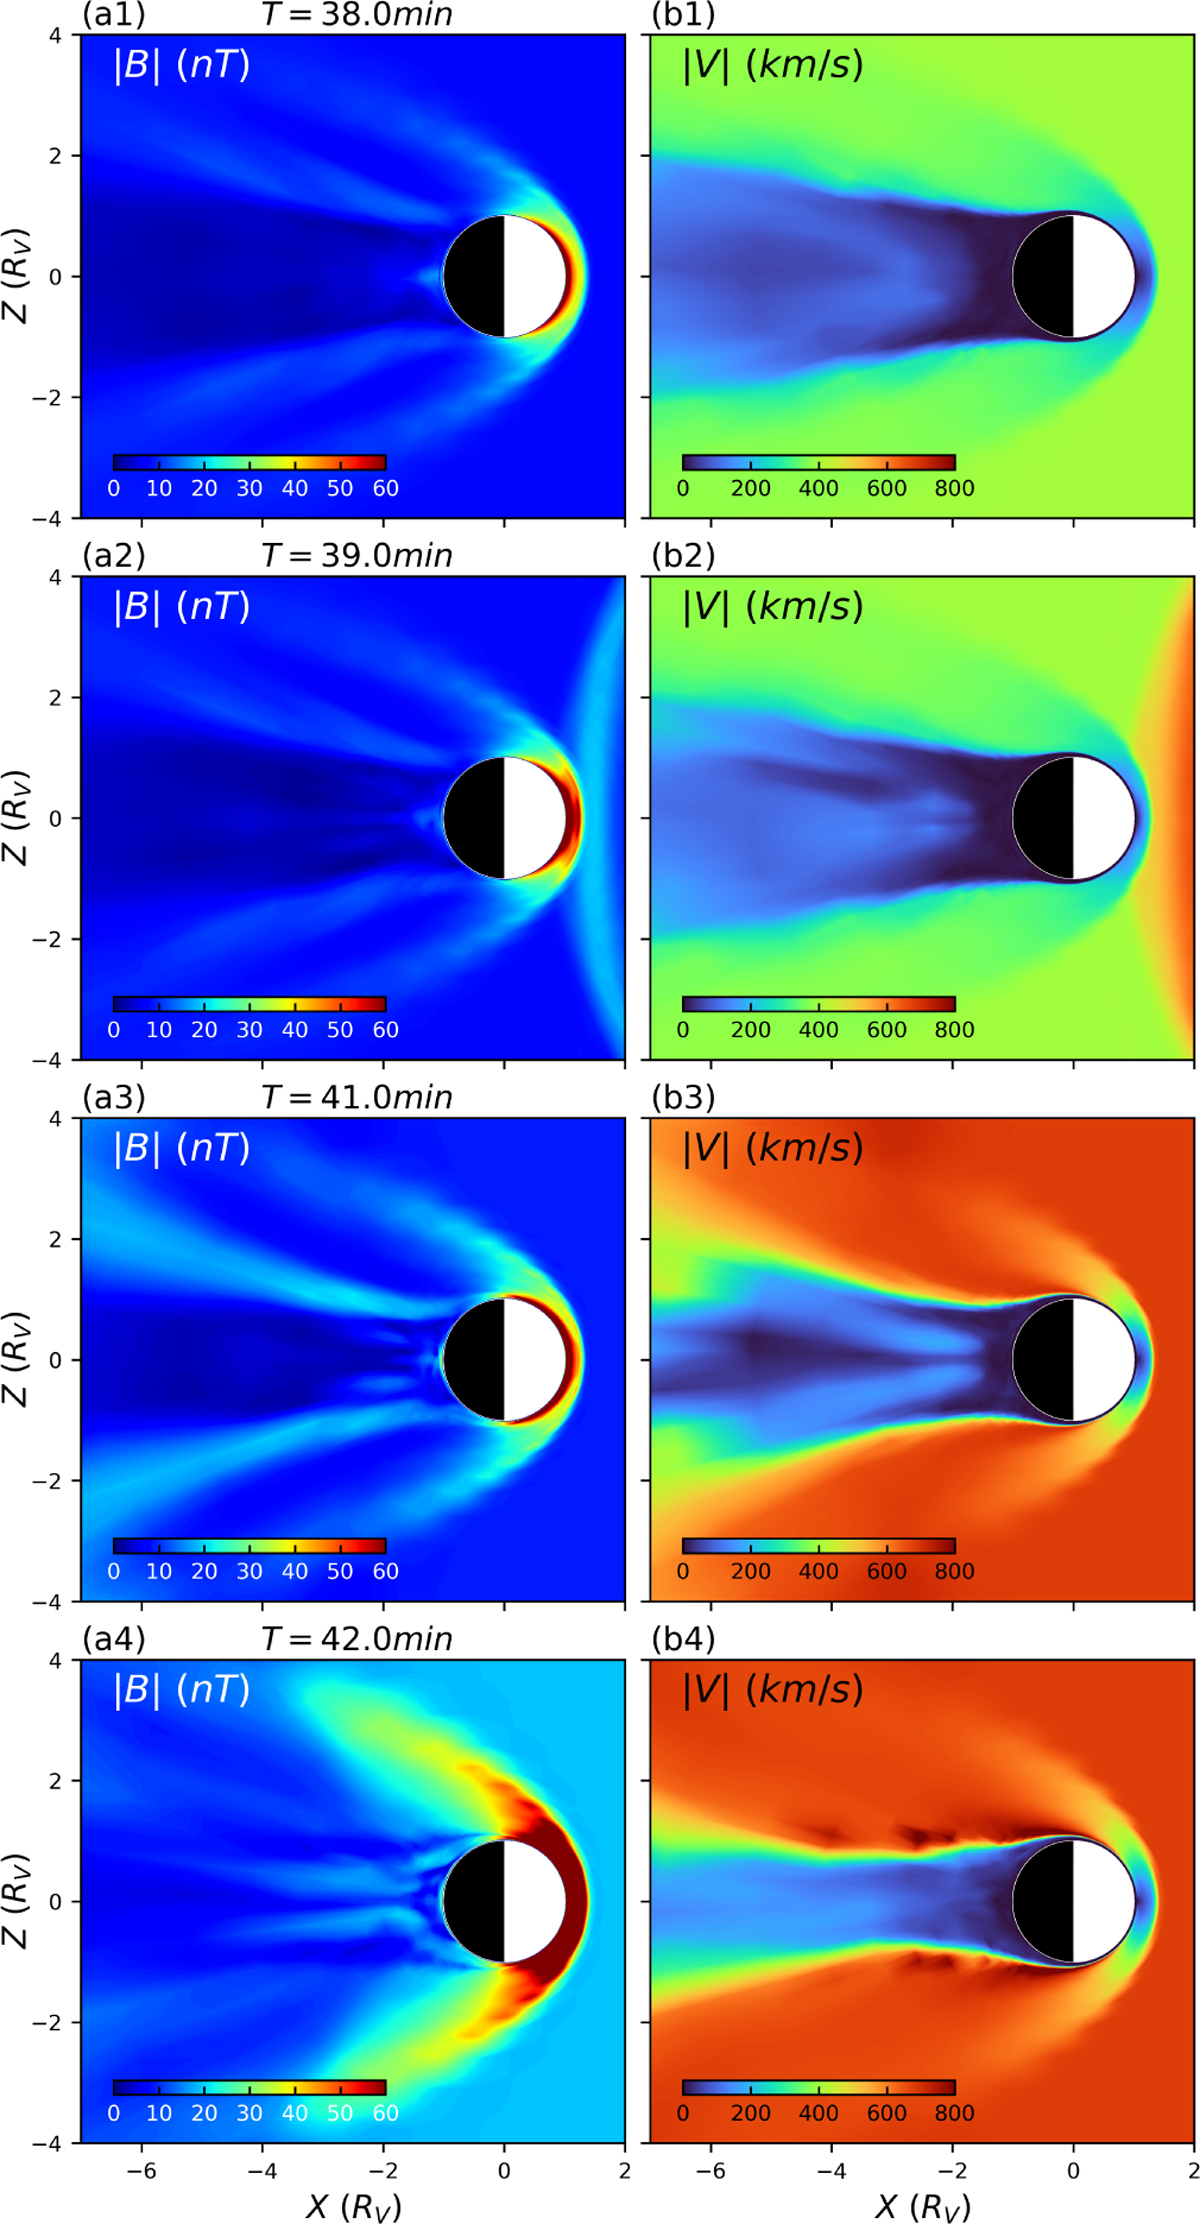
Temporal evolution of magnetic field strength and plasma flow speed in the X–Z plane at four selected times (38.0, 39.0, 41.0, and 42.0 min). Each row corresponds to a specific time point, with the left and right columns showing magnetic field strength (a) and plasma flow speed (b), respectively.
Current usage metrics show cumulative count of Article Views (full-text article views including HTML views, PDF and ePub downloads, according to the available data) and Abstracts Views on Vision4Press platform.
Data correspond to usage on the plateform after 2015. The current usage metrics is available 48-96 hours after online publication and is updated daily on week days.
Initial download of the metrics may take a while.