Fig. 4
Download original image
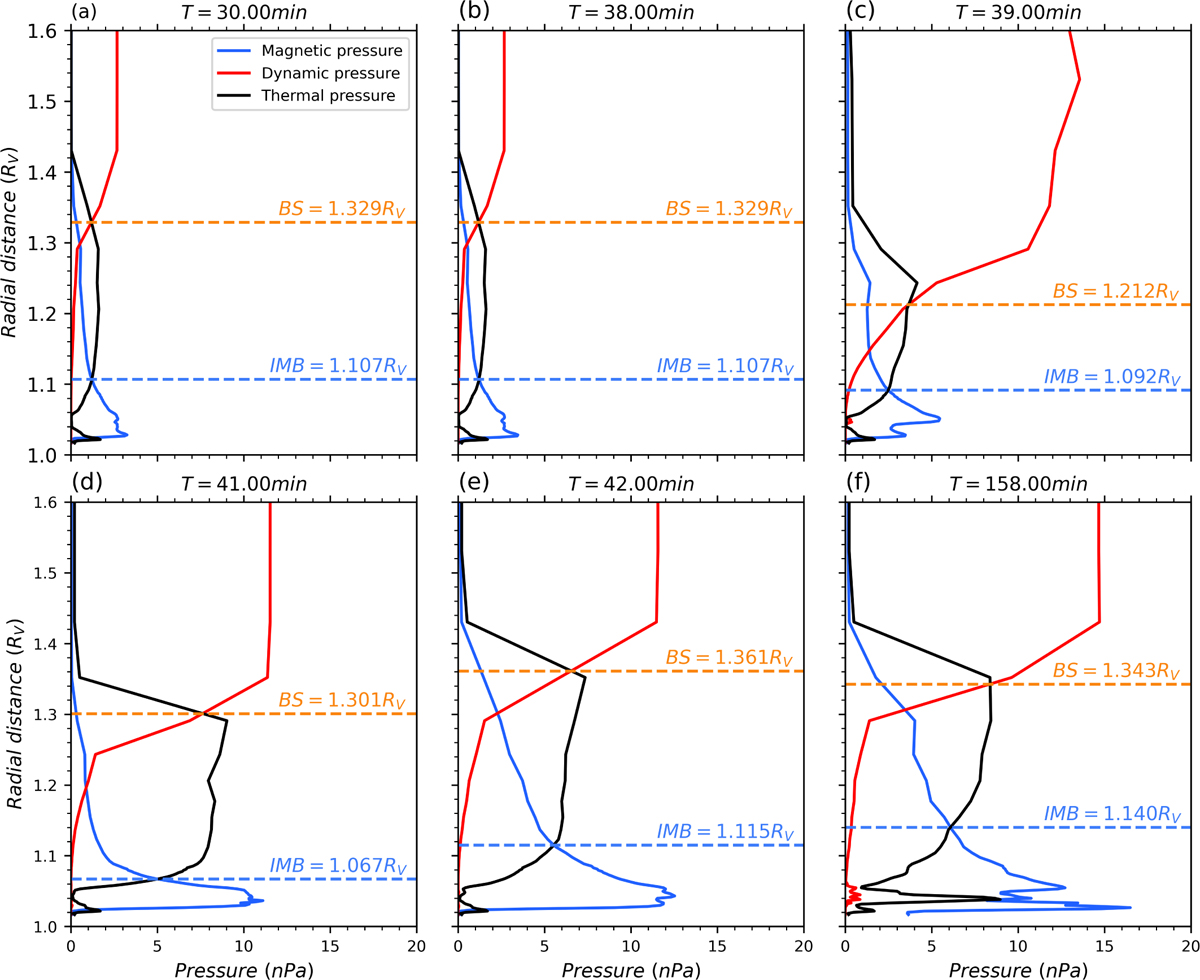
Altitude profiles of pressures along the Venus–Sun line at 30, 38, 39, 41, 42, 158 min of simulation (ICME shock arrives Venus at 39 min). The blue, red, and black lines represent magnetic pressure, dynamic pressure and thermal pressure, respectively. The BS and IMB locations are indicated by orange and light blue dashed lines, respectively.
Current usage metrics show cumulative count of Article Views (full-text article views including HTML views, PDF and ePub downloads, according to the available data) and Abstracts Views on Vision4Press platform.
Data correspond to usage on the plateform after 2015. The current usage metrics is available 48-96 hours after online publication and is updated daily on week days.
Initial download of the metrics may take a while.