Open Access
Fig. 5
Download original image
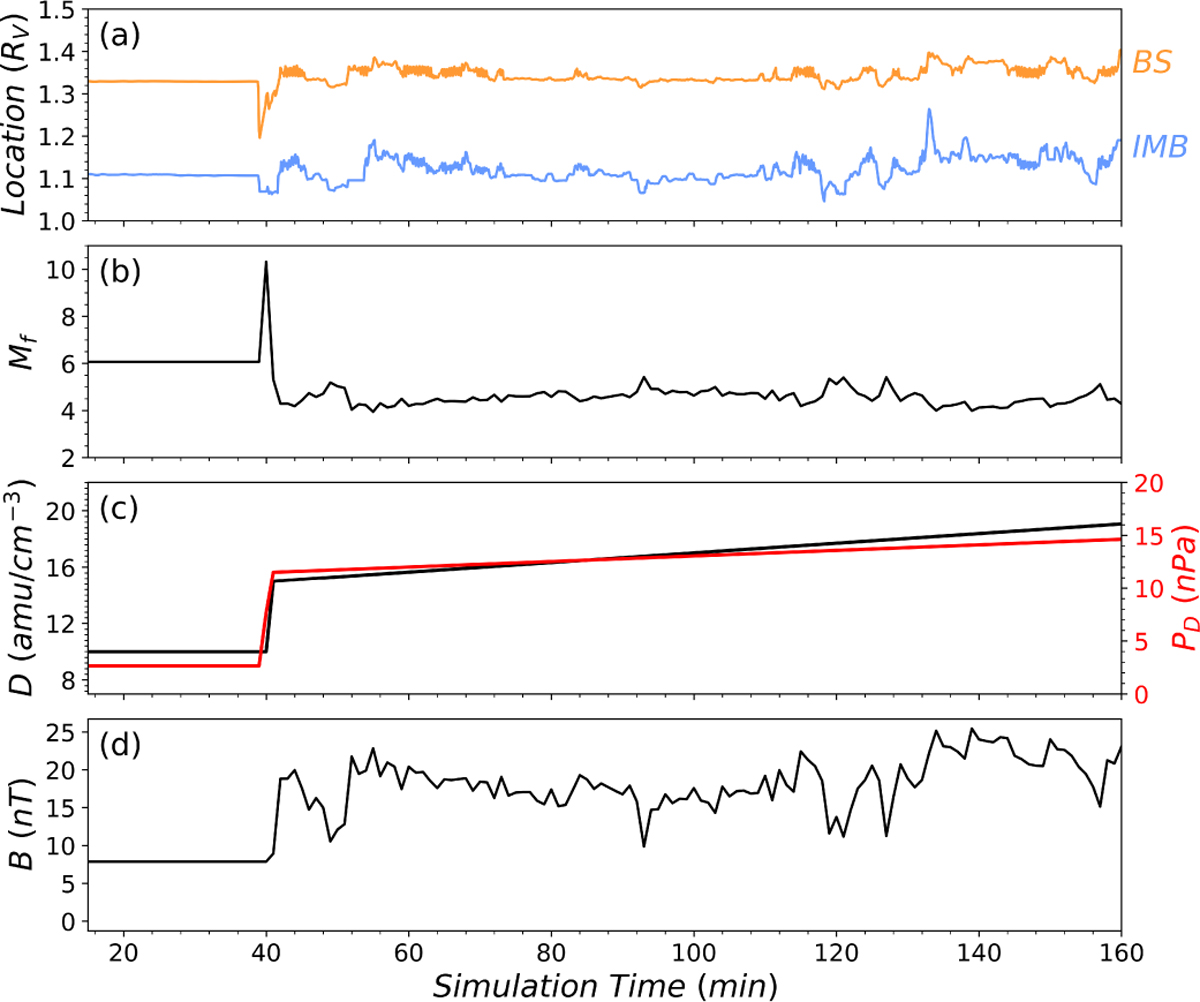
(a) Temporal evolution of the locations of subsolar BS (orange line) and IMB (blue line). The corresponding upstream conditions are shown in the panels below, including (b) fast magnetosonic Mach number (black line), (c) solar wind density (black line) and dynamic pressure (red line), and (d) IMF strength (black line).
Current usage metrics show cumulative count of Article Views (full-text article views including HTML views, PDF and ePub downloads, according to the available data) and Abstracts Views on Vision4Press platform.
Data correspond to usage on the plateform after 2015. The current usage metrics is available 48-96 hours after online publication and is updated daily on week days.
Initial download of the metrics may take a while.