Fig. 6
Download original image
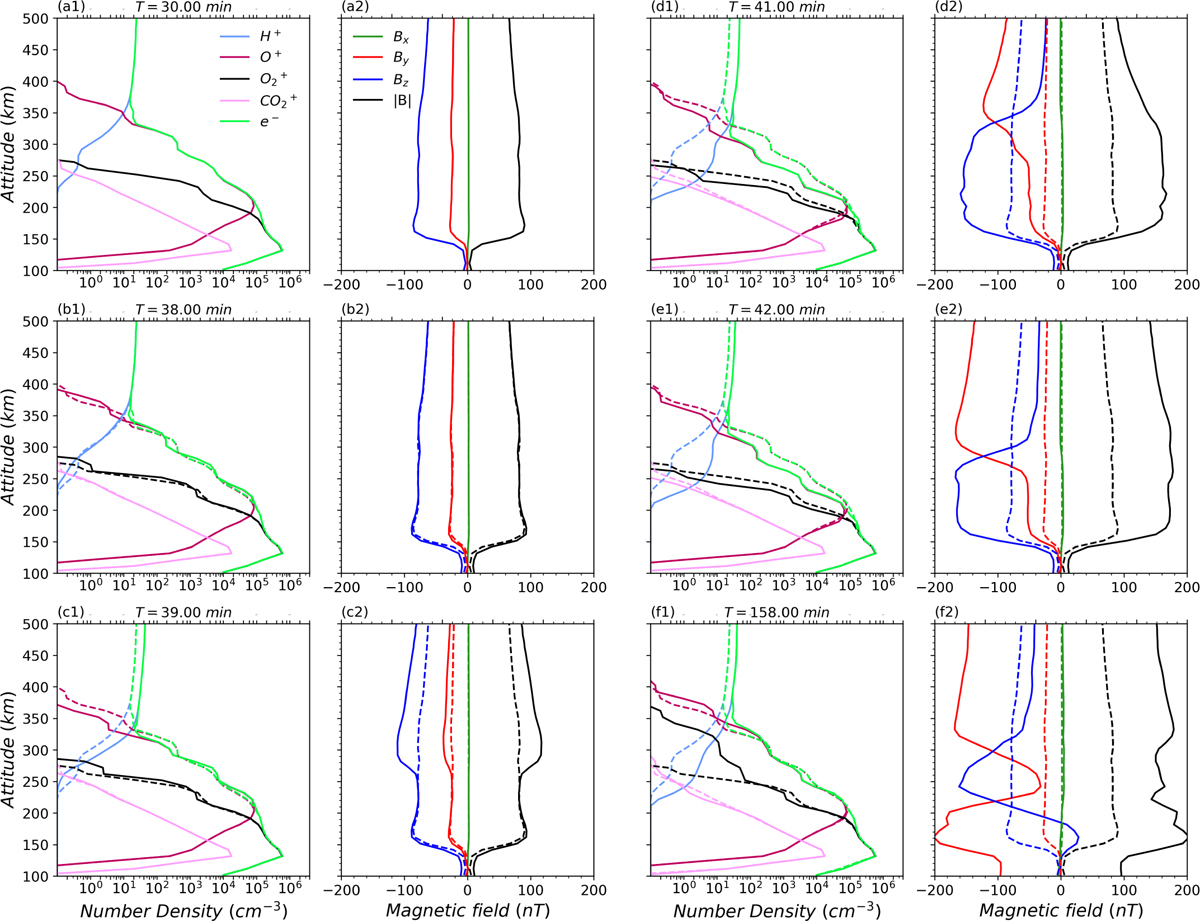
Altitude profiles of number density and magnetic field within the ionosphere along the subsolar line at 30, 38, 39, 41, 42, and 158 min of simulation. Figures a1, b1, c1, d1, e1, f1 show the altitude profiles of number densities of different ion species and electrons: H+ (blue), O+ (red), ![]() (black),
(black), ![]() (pink), and e− (green). Figures a2, b2, c2, d2, e2, f2 are altitude profiles of the induced magnetic field: Bx (blue), By (red), Bx (green), and |B| (black). The solid lines depict the profiles of the physical quantities at the times indicated above each panel, while the dashed lines show the corresponding distributions at 30 minutes, serving as a reference of quiet period for comparison.
(pink), and e− (green). Figures a2, b2, c2, d2, e2, f2 are altitude profiles of the induced magnetic field: Bx (blue), By (red), Bx (green), and |B| (black). The solid lines depict the profiles of the physical quantities at the times indicated above each panel, while the dashed lines show the corresponding distributions at 30 minutes, serving as a reference of quiet period for comparison.
Current usage metrics show cumulative count of Article Views (full-text article views including HTML views, PDF and ePub downloads, according to the available data) and Abstracts Views on Vision4Press platform.
Data correspond to usage on the plateform after 2015. The current usage metrics is available 48-96 hours after online publication and is updated daily on week days.
Initial download of the metrics may take a while.