Fig. 7
Download original image
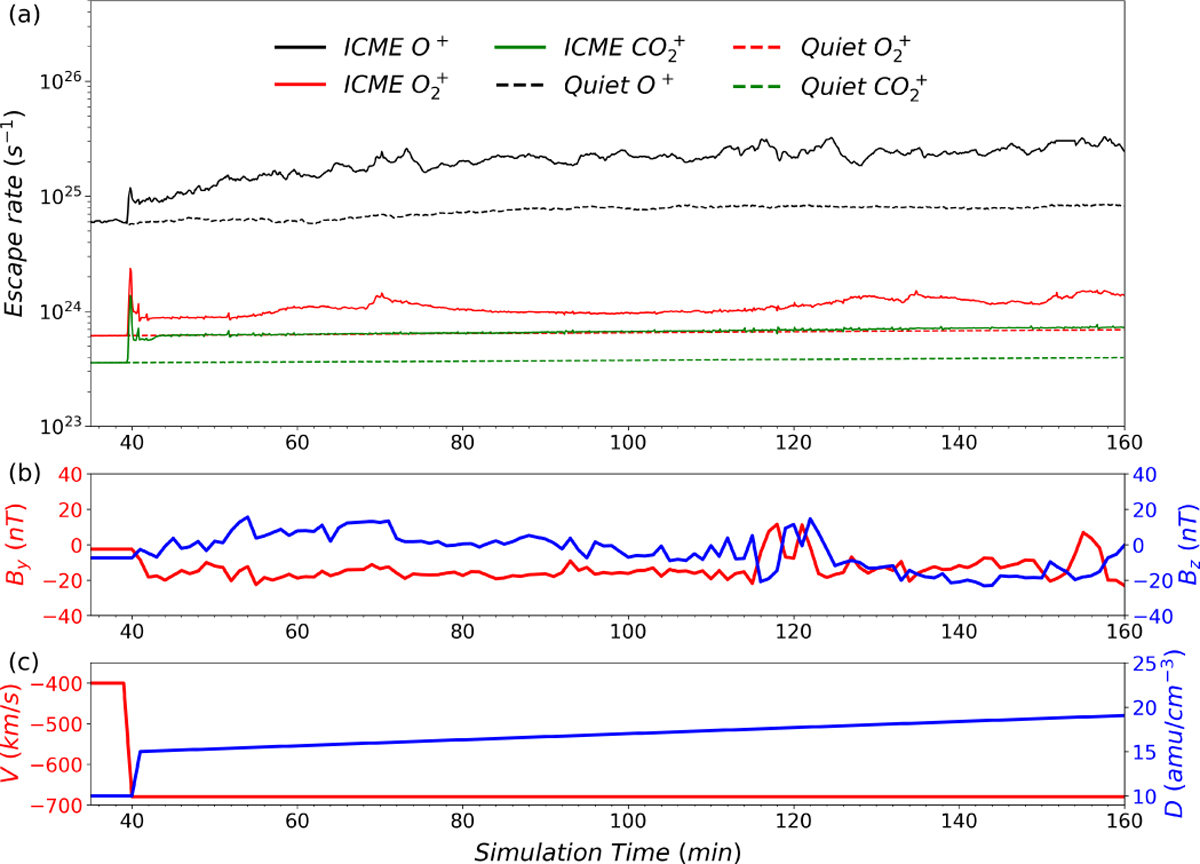
Temporal variations in (a) the escape rates in heavy ions and (b, c) the corresponding upstream solar wind plasma and IMF conditions. Panel (a) shows the escape rates of O+ (black), ![]() (red), and
(red), and ![]() (green). The dashed lines represent the escape rates of O+,
(green). The dashed lines represent the escape rates of O+, ![]() , and
, and ![]() under typical quiet solar wind conditions for reference. Panel (b) shows IMF By and Bz components, and Panel (c) displays solar wind plasma density and velocity.
under typical quiet solar wind conditions for reference. Panel (b) shows IMF By and Bz components, and Panel (c) displays solar wind plasma density and velocity.
Current usage metrics show cumulative count of Article Views (full-text article views including HTML views, PDF and ePub downloads, according to the available data) and Abstracts Views on Vision4Press platform.
Data correspond to usage on the plateform after 2015. The current usage metrics is available 48-96 hours after online publication and is updated daily on week days.
Initial download of the metrics may take a while.