Open Access
Fig. 8
Download original image
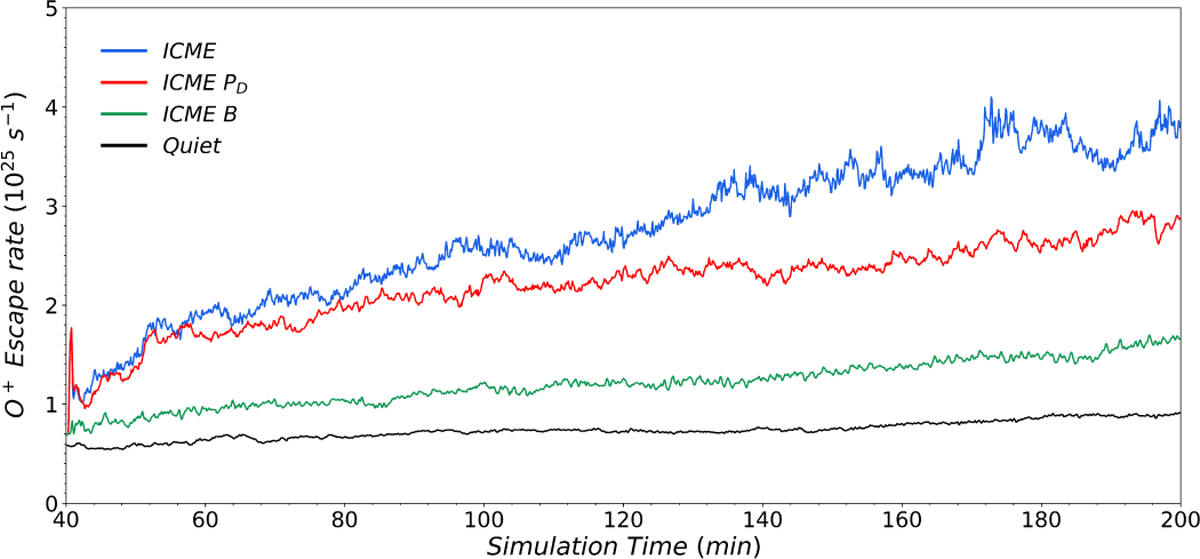
Temporal variations in the O+ escape rate under different solar wind plasma and IMF conditions. The blue, red, green, and black lines represent simulations with realistic ICME driving, with high dynamic pressure pulses of solar wind only, with enhanced IMF only, and quiet conditions, respectively.
Current usage metrics show cumulative count of Article Views (full-text article views including HTML views, PDF and ePub downloads, according to the available data) and Abstracts Views on Vision4Press platform.
Data correspond to usage on the plateform after 2015. The current usage metrics is available 48-96 hours after online publication and is updated daily on week days.
Initial download of the metrics may take a while.