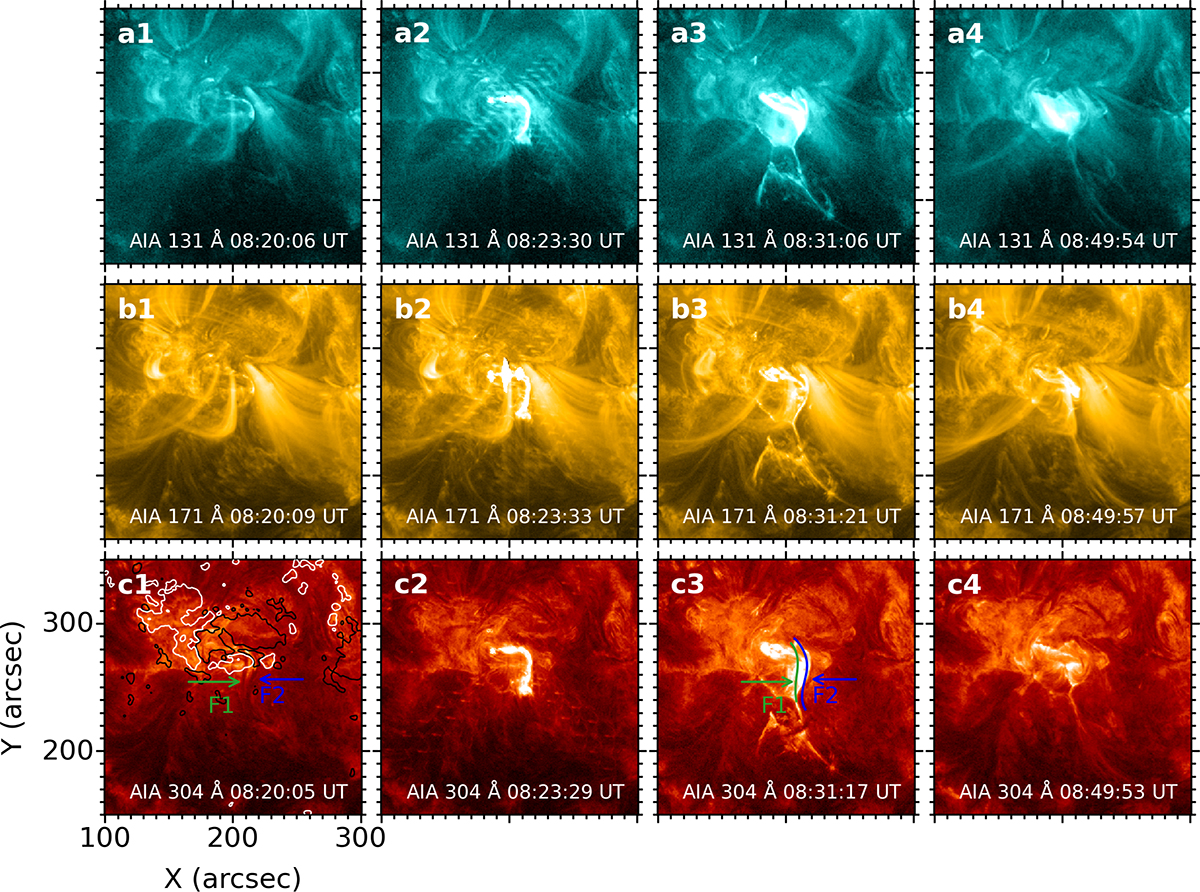
Fig. 2.
Download original image
EUV images in the AIA 131 Å, 171 Å, and 304 Å wavelengths (from top to bottom), showing the circular-ribbon flare and jet eruption. The white and black contours in panel c1 respectively represent the positive and negative magnetic fields of the HMI LOS magnetogram scaled at ±120 G. In panel c3 the green and blue curves mark the locations of filaments F1 and F2, respectively, as observed in panel c1. (The associated movie is available online).
Current usage metrics show cumulative count of Article Views (full-text article views including HTML views, PDF and ePub downloads, according to the available data) and Abstracts Views on Vision4Press platform.
Data correspond to usage on the plateform after 2015. The current usage metrics is available 48-96 hours after online publication and is updated daily on week days.
Initial download of the metrics may take a while.