Fig. 5.
Download original image
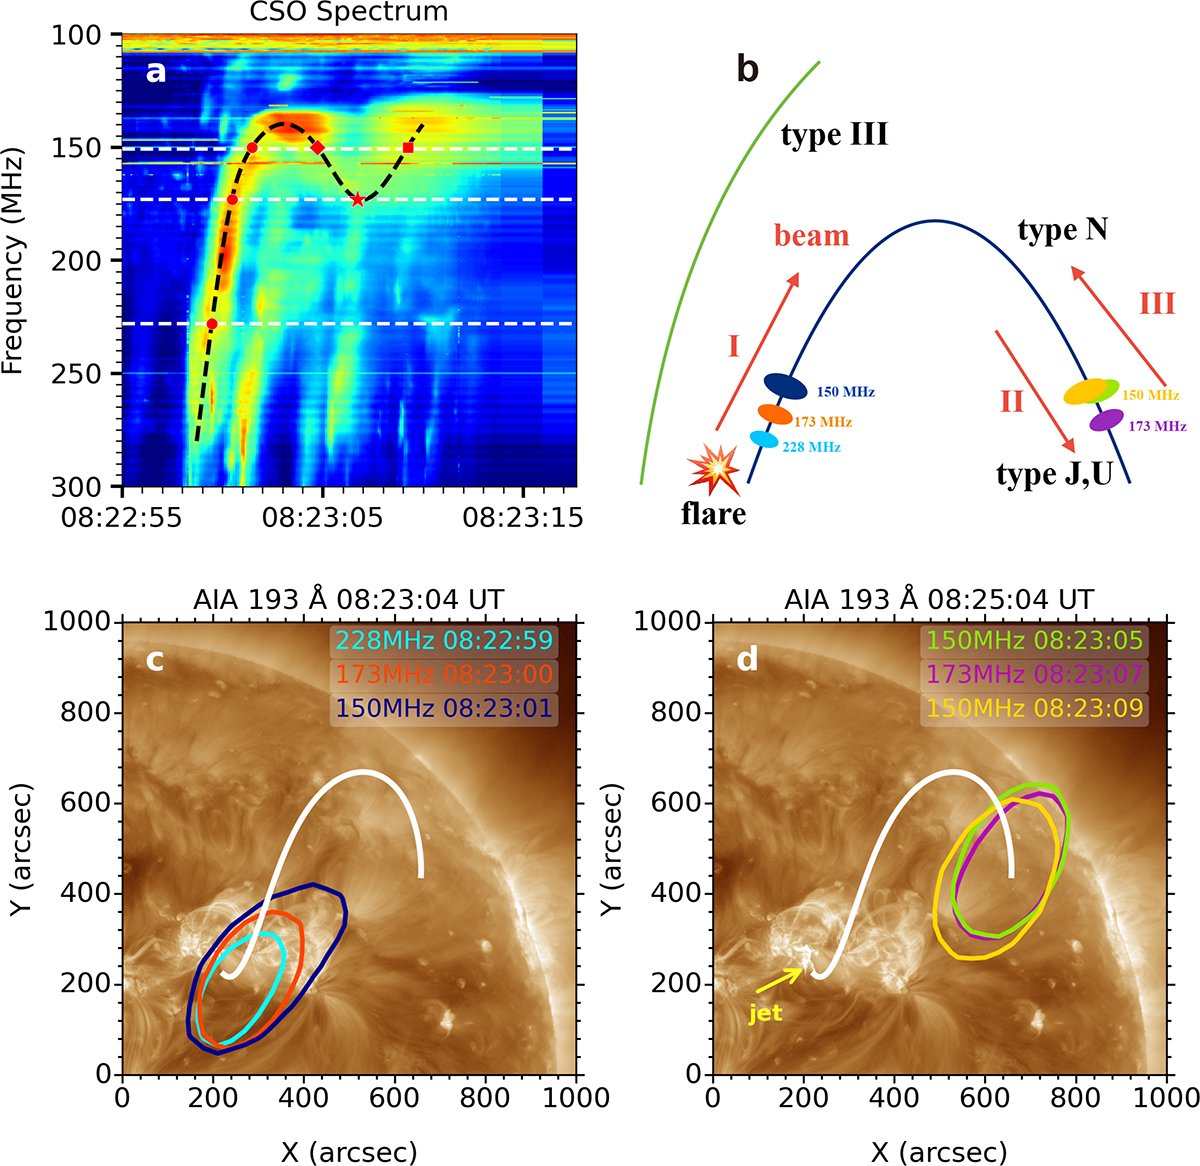
Radio spectral and imaging observations of the type N burst (harmonic emission). (a) CSO/CBSm radio spectrum, the type N burst is outlined by the black dashed curve. The white dashed lines indicate the three NRH imaging frequencies at 150, 173, and 228 MHz. The red symbols mark the six selected data points shown in panels c and d. (b) Schematic diagram illustrating the generation of a type N burst. The red arrows indicate the propagation directions of the electron beam, while the blue and green curves represent closed and open magnetic field lines, respectively. The ellipses on the closed loop correspond to the radio source locations shown in panels c and d. (c) NRH radio sources superposed on the AIA 193 Å image at three times, as marked by the red dots in panel a. The contours represent 70% of the maximum of each NRH image and are plotted in blue, red, and cyan at three frequencies (150, 173, 228 MHz), respectively. (d) NRH contours corresponding to the data points marked by the red diamond, asterisk, and square in panel a. The white curve represents a schematic of the large-scale closed loop. The yellow arrow points to the position of the jet.
Current usage metrics show cumulative count of Article Views (full-text article views including HTML views, PDF and ePub downloads, according to the available data) and Abstracts Views on Vision4Press platform.
Data correspond to usage on the plateform after 2015. The current usage metrics is available 48-96 hours after online publication and is updated daily on week days.
Initial download of the metrics may take a while.