Fig. 6.
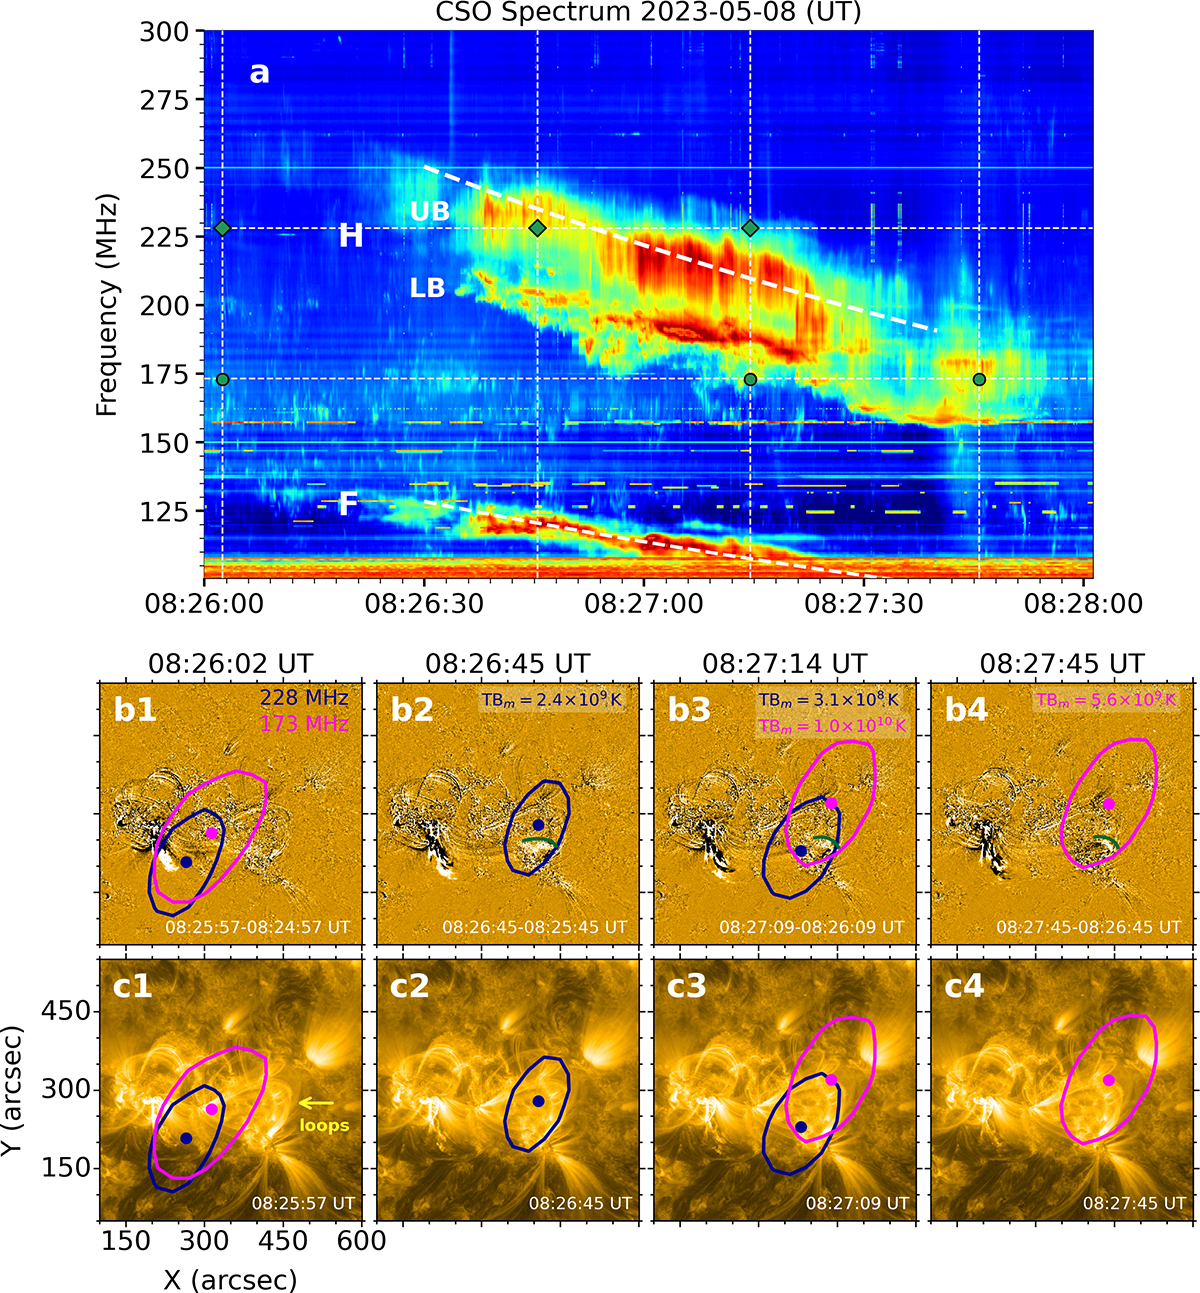
Download original image
Radio spectrum and temporal evolution of NRH sources of the type II radio burst. (a) CSO/CBSm dynamic spectrum. The white horizontal dashed lines indicate the two NRH imaging frequencies, 173 and 228 MHz. The vertical dashed lines indicate the four selected times shown in the four columns below. The two white dashed curves indicate spectral fitting of the type II burst bands using the Newkirk density model and a shock speed of 800 km s−1. (b1)–(b4) and (c1)–(c4) AIA 171 Å running-difference and original images overplotted with the NRH sources at 173 MHz (magenta) and 228 MHz (dark blue). The contours represent 80% of the maximum brightness temperatures (TBm) and the filled circles denote the centroids of the radio sources from elliptical Gaussian fits. The green curves in panels b2–b4 highlight the wave-like disturbance front. The yellow arrow in panel c1 points to the closed loops.
Current usage metrics show cumulative count of Article Views (full-text article views including HTML views, PDF and ePub downloads, according to the available data) and Abstracts Views on Vision4Press platform.
Data correspond to usage on the plateform after 2015. The current usage metrics is available 48-96 hours after online publication and is updated daily on week days.
Initial download of the metrics may take a while.