Fig. 1
Download original image
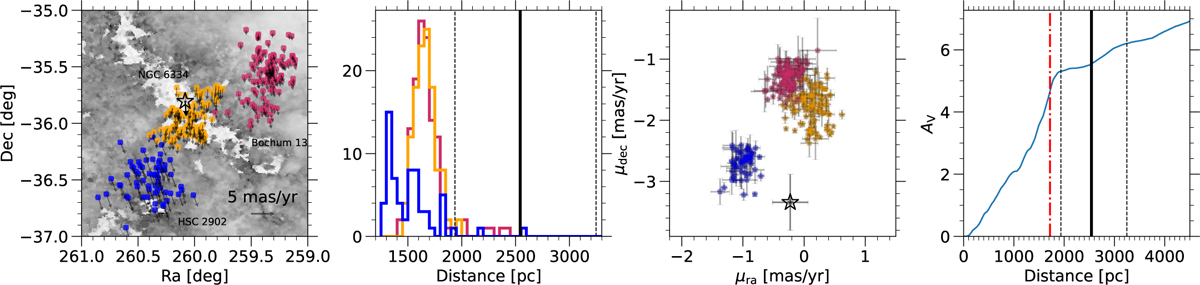
Far left: spatial distribution of clusters from Hunt & Reffert (2023) in the vicinity of Gaia20dsk (shown with a star), overlaid on the DECaPS dust map (Zucker et al. 2025). The arrows indicate the proper motions of the cluster members. Left center: distance distribution of the cluster members. The thick solid and dashed lines show the dBJ distance of Gaia20dsk and its uncertainties. Right center: proper motion distribution of the cluster members and Gaia20dsk, shown with error bars. Far right: Cumulative reddening as a function of distance toward Gaia20dsk, based on the data from Zucker et al. (2025). The red dash-dotted line indicates the most likely distance to Gaia20dsk, while the black solid and dashed lines represent dBJ and its uncertainties.
Current usage metrics show cumulative count of Article Views (full-text article views including HTML views, PDF and ePub downloads, according to the available data) and Abstracts Views on Vision4Press platform.
Data correspond to usage on the plateform after 2015. The current usage metrics is available 48-96 hours after online publication and is updated daily on week days.
Initial download of the metrics may take a while.