Fig. 2
Download original image
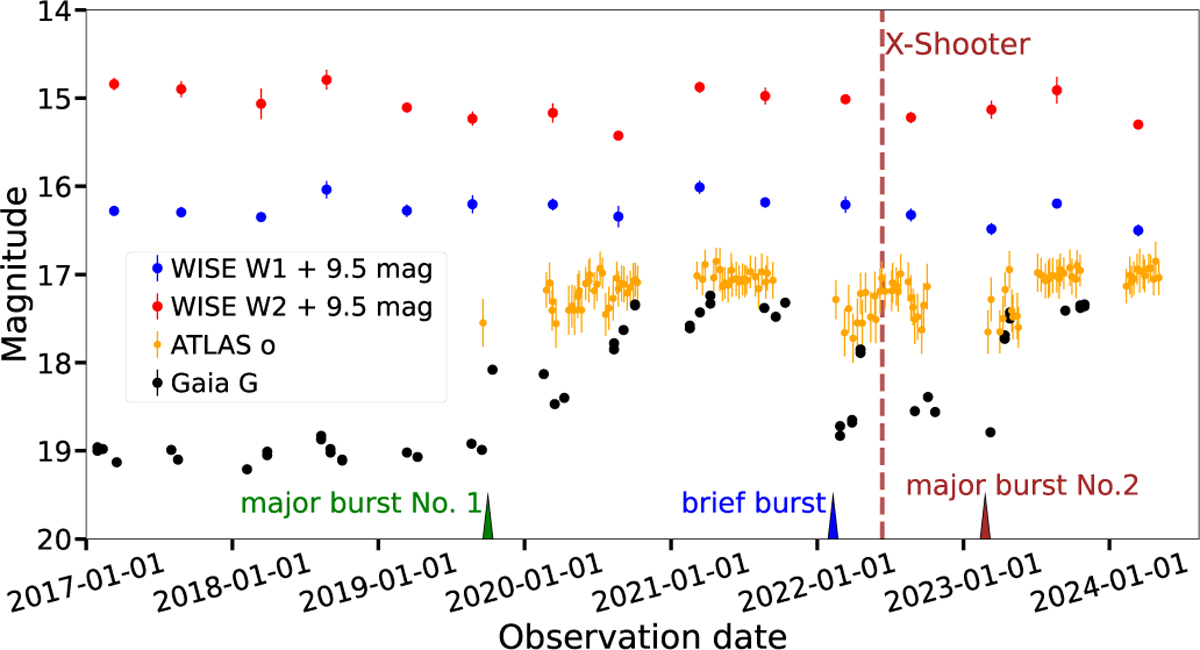
Gaia20dsk light curve. Gaia G photometry is represented by black dots, with error bars similar in size to or smaller than the data points. ATLAS o weekly median photometry is shown in orange. The WISE W1 and W2 bands are represented by blue and red dots, shifted by 9.5 mag for clarity. The dashed vertical line indicates the date of the X-shooter measurements. The three triangles at the bottom of the plot mark the first major burst, which began in 2019 October (green); a short brightening event around 2022 February (blue). A second major burst that started in 2023 February (brown).
Current usage metrics show cumulative count of Article Views (full-text article views including HTML views, PDF and ePub downloads, according to the available data) and Abstracts Views on Vision4Press platform.
Data correspond to usage on the plateform after 2015. The current usage metrics is available 48-96 hours after online publication and is updated daily on week days.
Initial download of the metrics may take a while.