Fig. E.1
Download original image
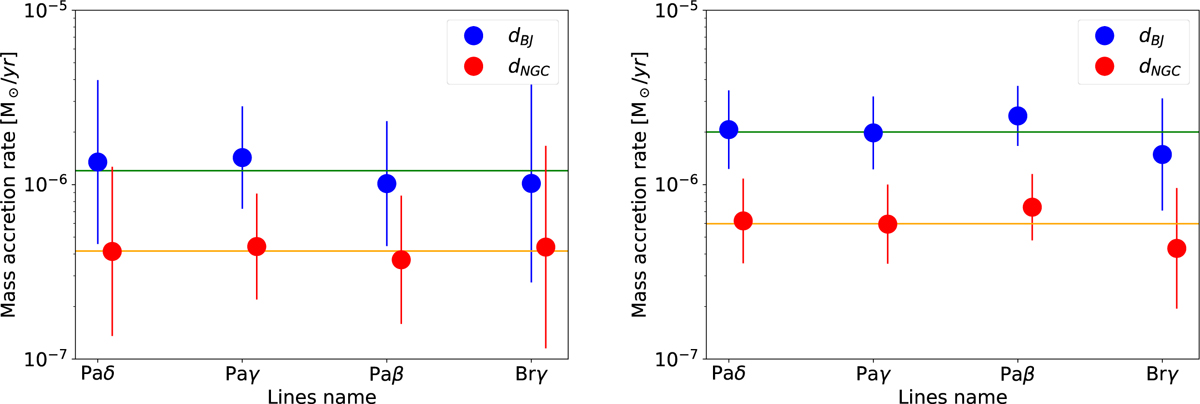
Mass accretion rate of Gaia20dsk per different accretion-tracing line and considering two different distances. The spectral lines are in order of ascending wavelength. The horizontal green and orange lines show the mean value of the calculated mass accretion rate considering dBJ and dNGC, respectively. The left panel shows the result based on Alcalá et al. (2017) coefficient, while the right panel shows the result based on the Fairlamb et al. (2017) coeeficient.
Current usage metrics show cumulative count of Article Views (full-text article views including HTML views, PDF and ePub downloads, according to the available data) and Abstracts Views on Vision4Press platform.
Data correspond to usage on the plateform after 2015. The current usage metrics is available 48-96 hours after online publication and is updated daily on week days.
Initial download of the metrics may take a while.