Fig. 4
Download original image
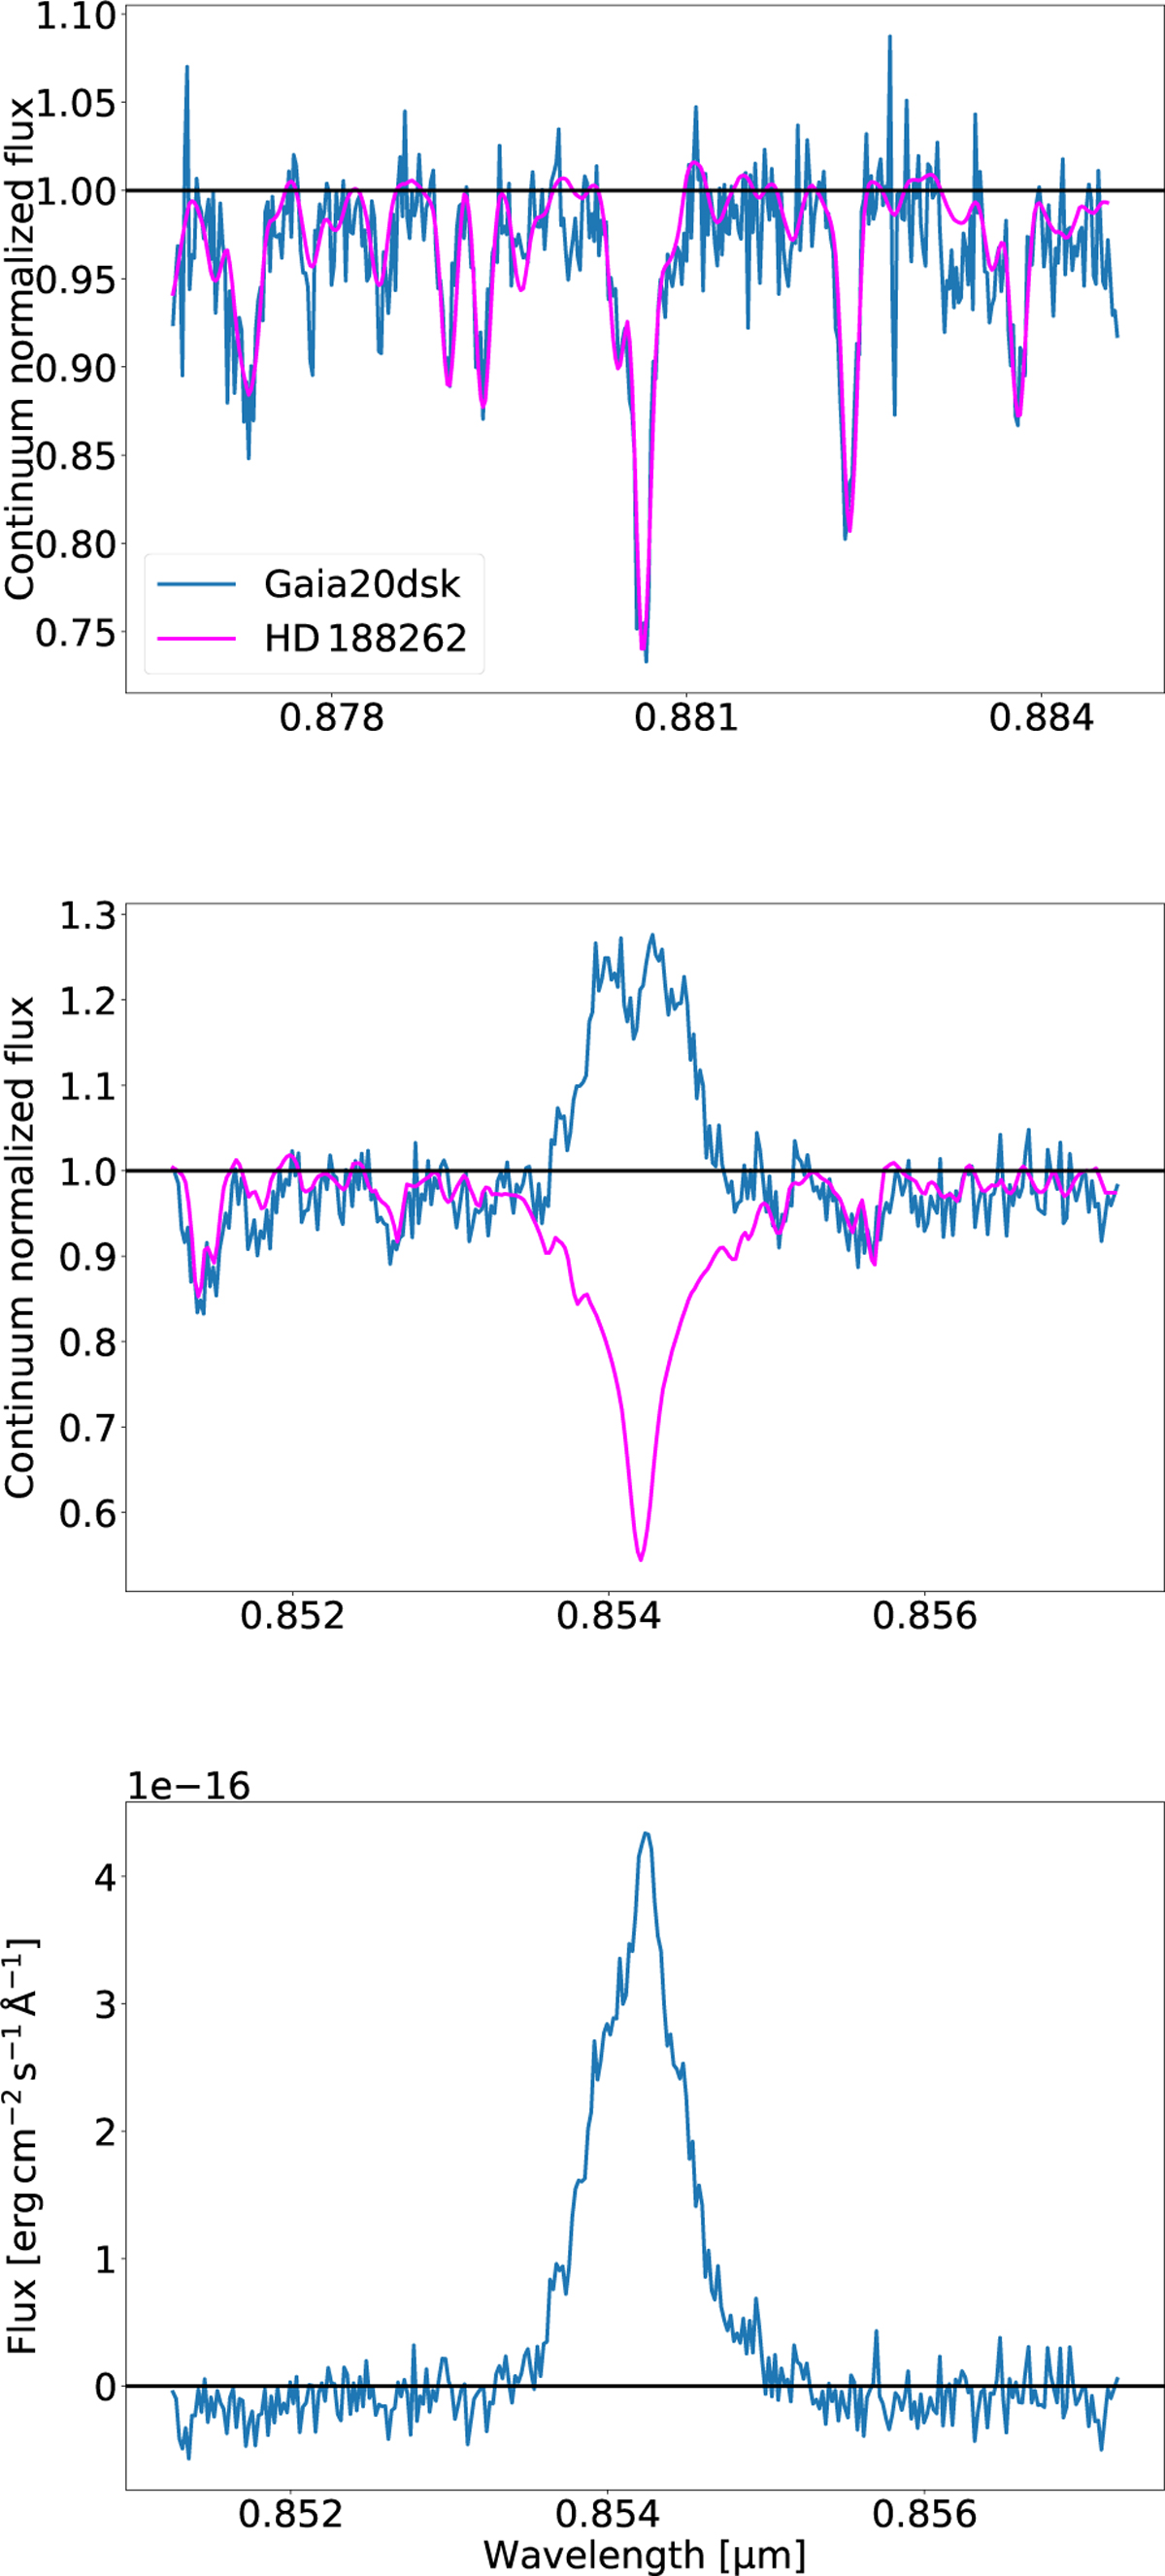
Top panel: segment of the spectra of our target Gaia20dsk (in blue) and the best-fitting photosphere HD 188262 (shown in magenta). See Sect. 3.1 for details. Middle panel: example of one of the Ca II lines before correction with the best-fitting photosphere. The colors indicate the same sources as in the top panel. Bottom panel: photosphere-subtracted accretion-tracing line.
Current usage metrics show cumulative count of Article Views (full-text article views including HTML views, PDF and ePub downloads, according to the available data) and Abstracts Views on Vision4Press platform.
Data correspond to usage on the plateform after 2015. The current usage metrics is available 48-96 hours after online publication and is updated daily on week days.
Initial download of the metrics may take a while.