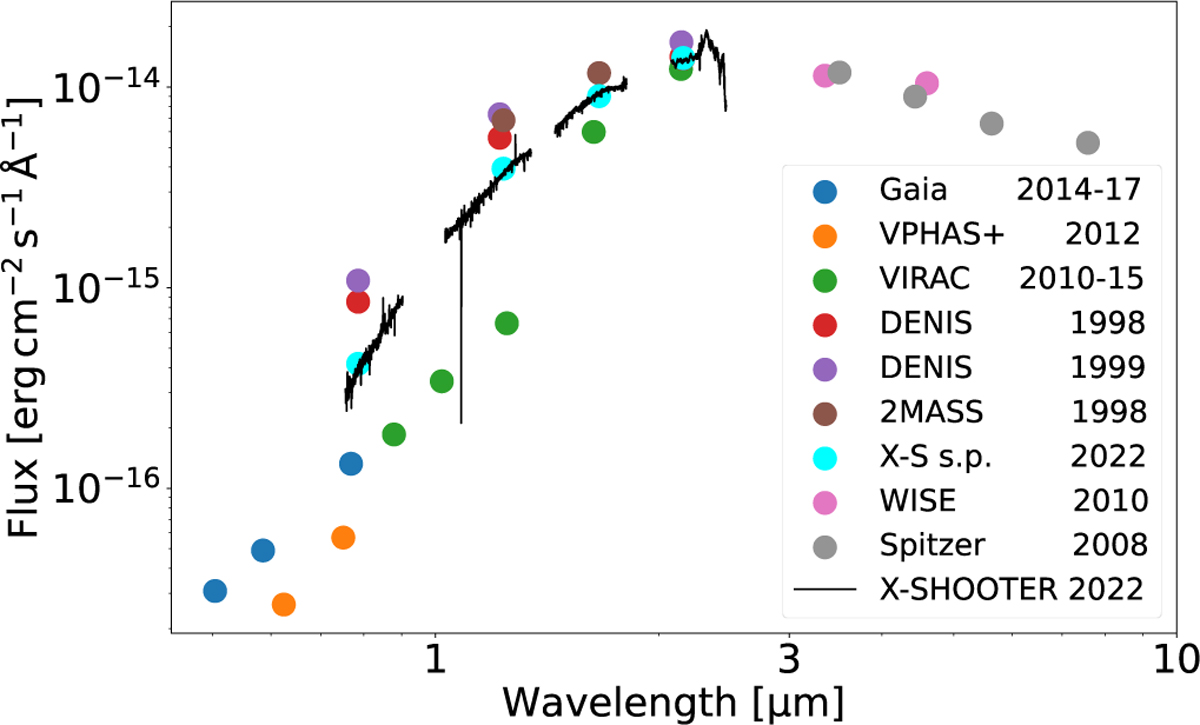
Fig. 5
Download original image
Gaia20dsk SED. Different colored dots denote different surveys, as explained in the legend. The synthetic photometry in I, J, H, and Ks bands represented by the cyan color were computed from the X-shooter spectrum (labeled X-S s.p.). The spectrum itself is plotted with reduced resolution for clarity. The points are not corrected for extinction. The sizes of the error bars are comparable to or smaller than the symbol size.
Current usage metrics show cumulative count of Article Views (full-text article views including HTML views, PDF and ePub downloads, according to the available data) and Abstracts Views on Vision4Press platform.
Data correspond to usage on the plateform after 2015. The current usage metrics is available 48-96 hours after online publication and is updated daily on week days.
Initial download of the metrics may take a while.