Fig. 6
Download original image
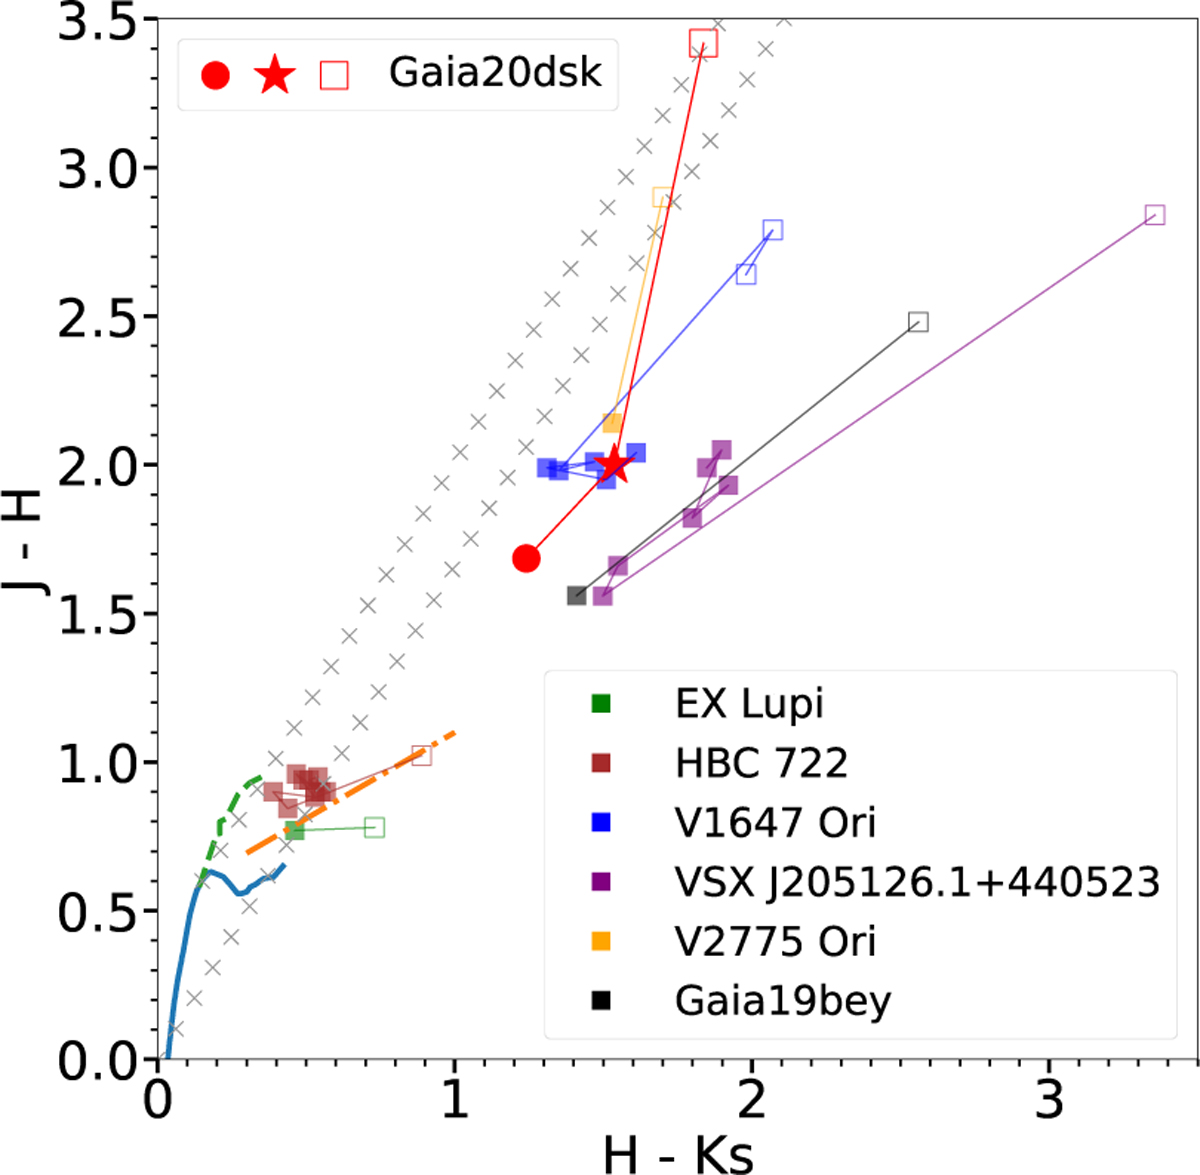
J−H versus H−Ks diagram. The main sequence is represented by a blue thick solid line (Pecaut & Mamajek 2013), the giant branch by a green dashed line (Koornneef 1983), and the reddening path (with AV=1 mag steps) by gray cross symbols (Cardelli et al. 1989). The T Tauri locus is shown as an orange dash-dotted line (Meyer et al. 1997). Open squares denote quiescent colors, while filled squares represent outburst colors. For Gaia20dsk, the filled dot corresponds to the 2MASS measurements from 1998, the filled square to the VIRAC measurements (2010–2015), and the star symbol indicates synthetic photometry derived from the X-shooter spectrum (2020). The error sizes are smaller than or comparable to the symbol sizes.
Current usage metrics show cumulative count of Article Views (full-text article views including HTML views, PDF and ePub downloads, according to the available data) and Abstracts Views on Vision4Press platform.
Data correspond to usage on the plateform after 2015. The current usage metrics is available 48-96 hours after online publication and is updated daily on week days.
Initial download of the metrics may take a while.