Open Access
Fig. 7
Download original image
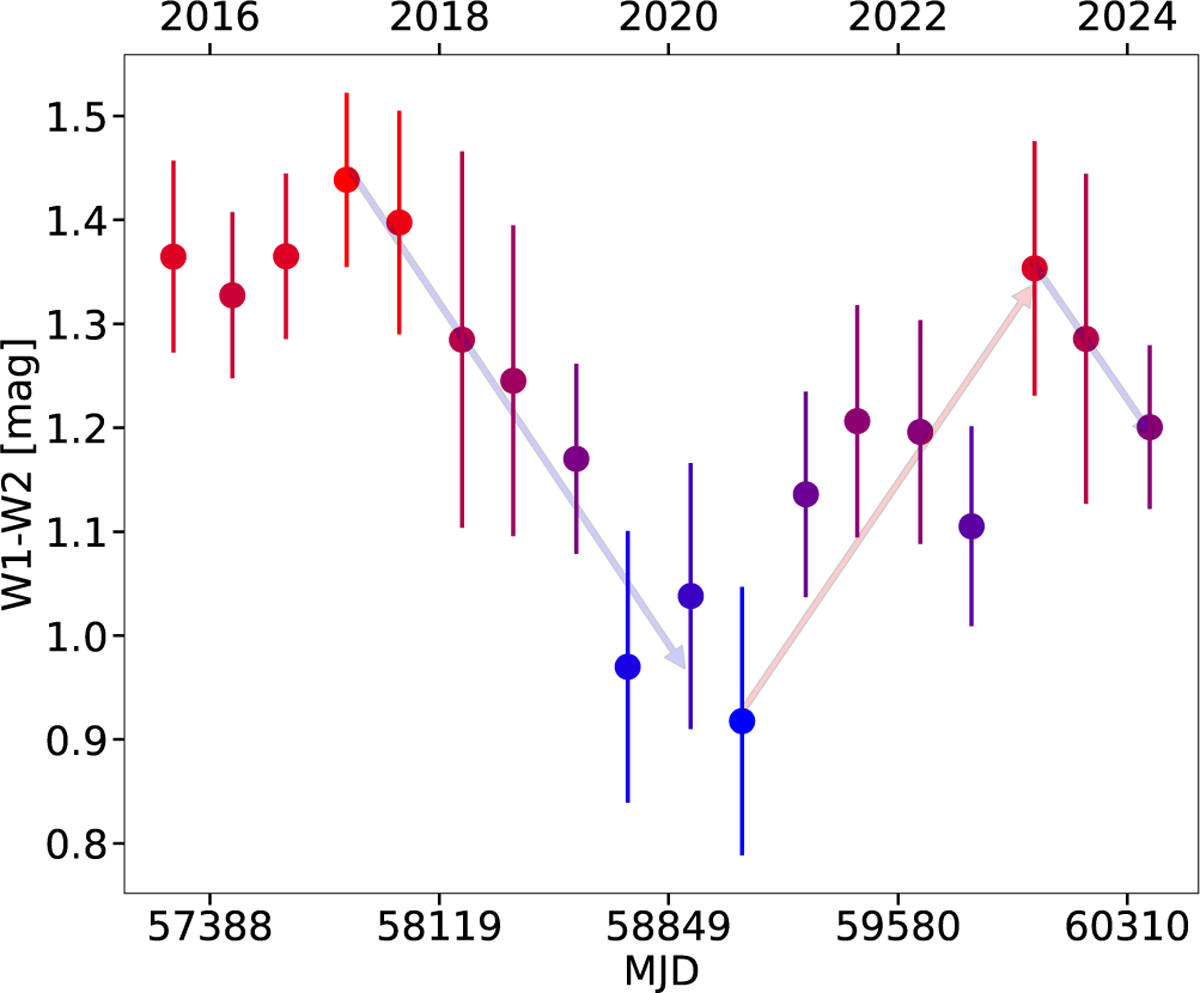
WISE W1−W2 color curve. The panel illustrates how Gaia20dsk became bluer approaching the first major brightening event. Following this, two episodes of blueward color changes occur, superimposed on an overall reddening trend, which coincide with the brief and second major bursts.
Current usage metrics show cumulative count of Article Views (full-text article views including HTML views, PDF and ePub downloads, according to the available data) and Abstracts Views on Vision4Press platform.
Data correspond to usage on the plateform after 2015. The current usage metrics is available 48-96 hours after online publication and is updated daily on week days.
Initial download of the metrics may take a while.