Open Access
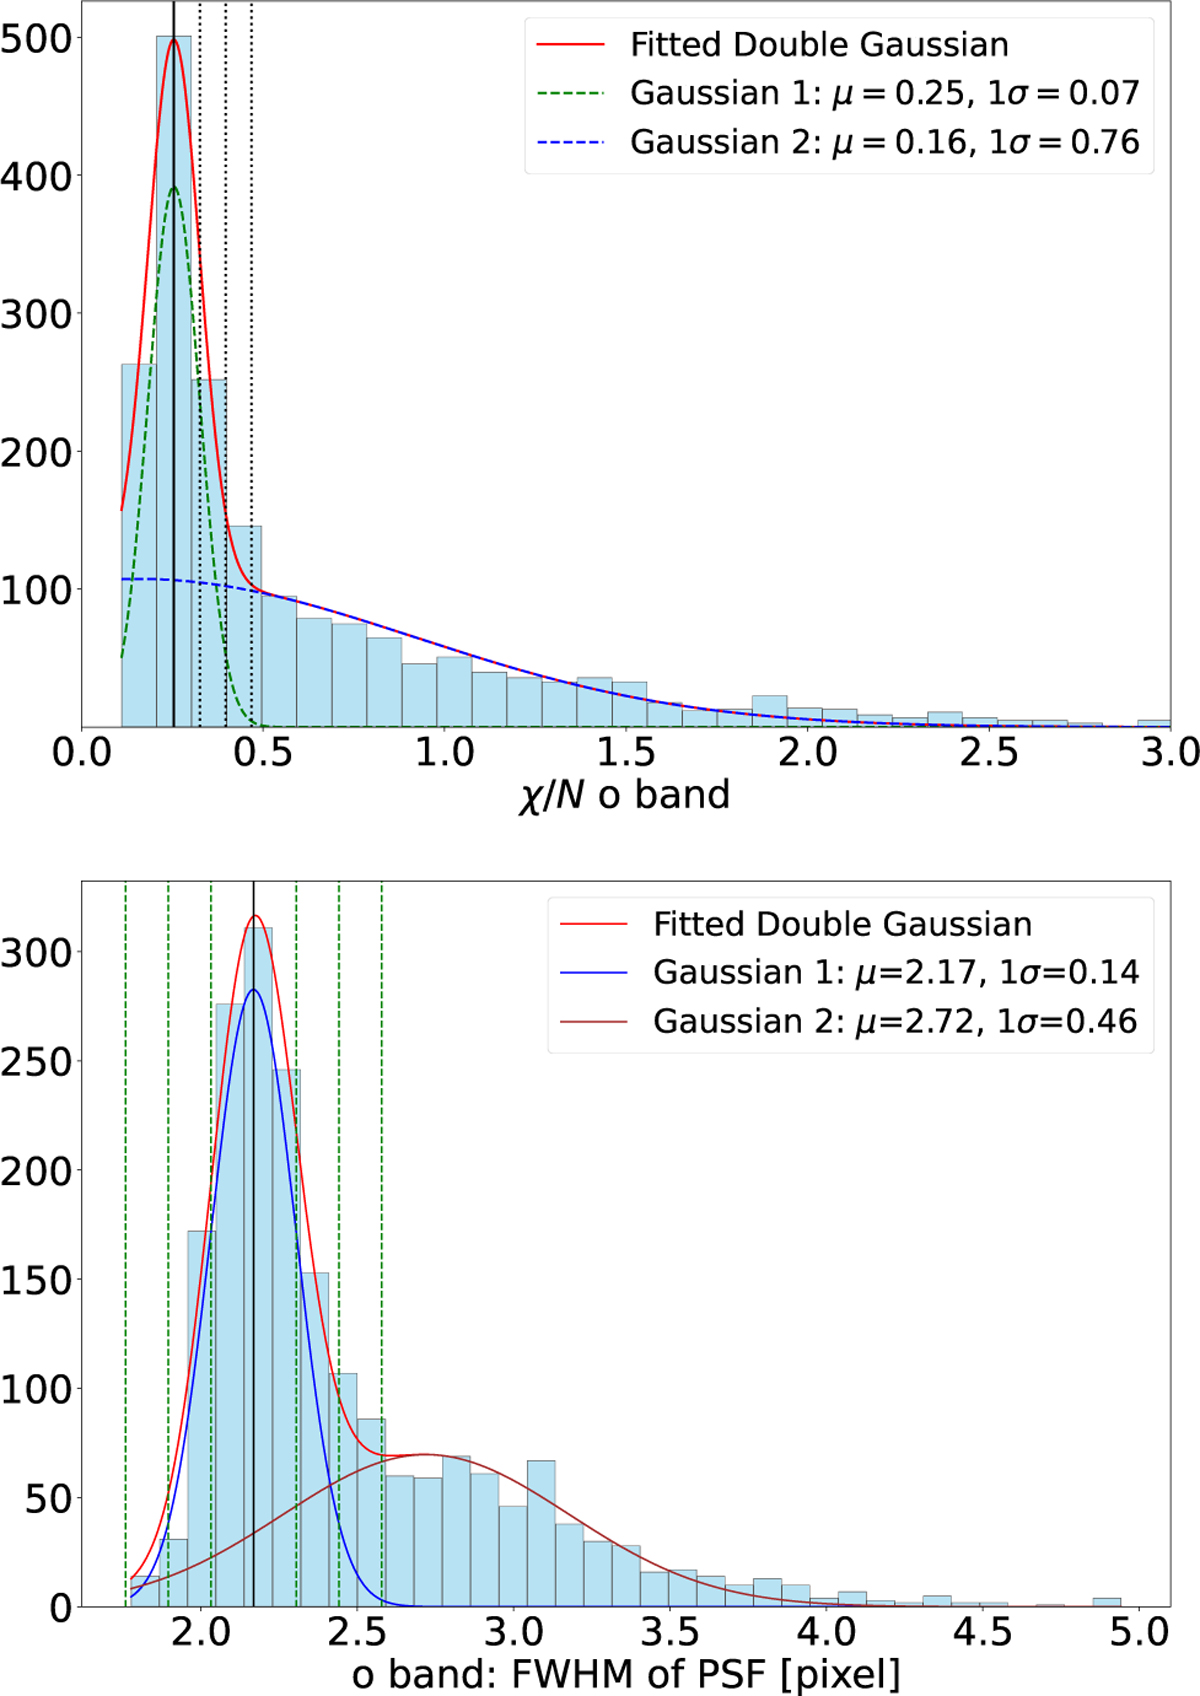
Fig. A.1
Download original image
ATLAS filtering method for the o band. The histograms of χ/N and FWHM were fit with two Gaussian functions. The solid line indicates the mean of the Gaussian closest to the major peak of the distribution. The dashed lines represent this mean value plus/minus the 1σ, 2σ, and 3σ standard deviation.
Current usage metrics show cumulative count of Article Views (full-text article views including HTML views, PDF and ePub downloads, according to the available data) and Abstracts Views on Vision4Press platform.
Data correspond to usage on the plateform after 2015. The current usage metrics is available 48-96 hours after online publication and is updated daily on week days.
Initial download of the metrics may take a while.