Fig. 3.
Download original image
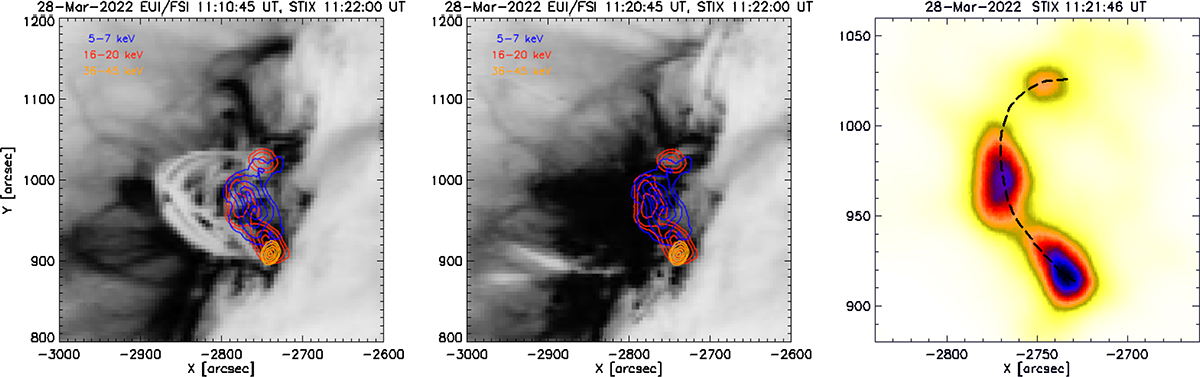
EUI/FSI 174 Å images (negative greyscale) were obtained (a) at 11:10:45 UT and (b) at 11:20:45 UT. Contours of the X-ray sources in 5–7, 16–20, and 36–45 keV energy ranges are outlined on the images (blue, red, and orange solid lines, respectively). The loop was determined manually from STIX images outlined on image 16–20 keV at 11:21:46 UT (black dashed line). Projection effects are more negligible for the southern footpoint (c).
Current usage metrics show cumulative count of Article Views (full-text article views including HTML views, PDF and ePub downloads, according to the available data) and Abstracts Views on Vision4Press platform.
Data correspond to usage on the plateform after 2015. The current usage metrics is available 48-96 hours after online publication and is updated daily on week days.
Initial download of the metrics may take a while.