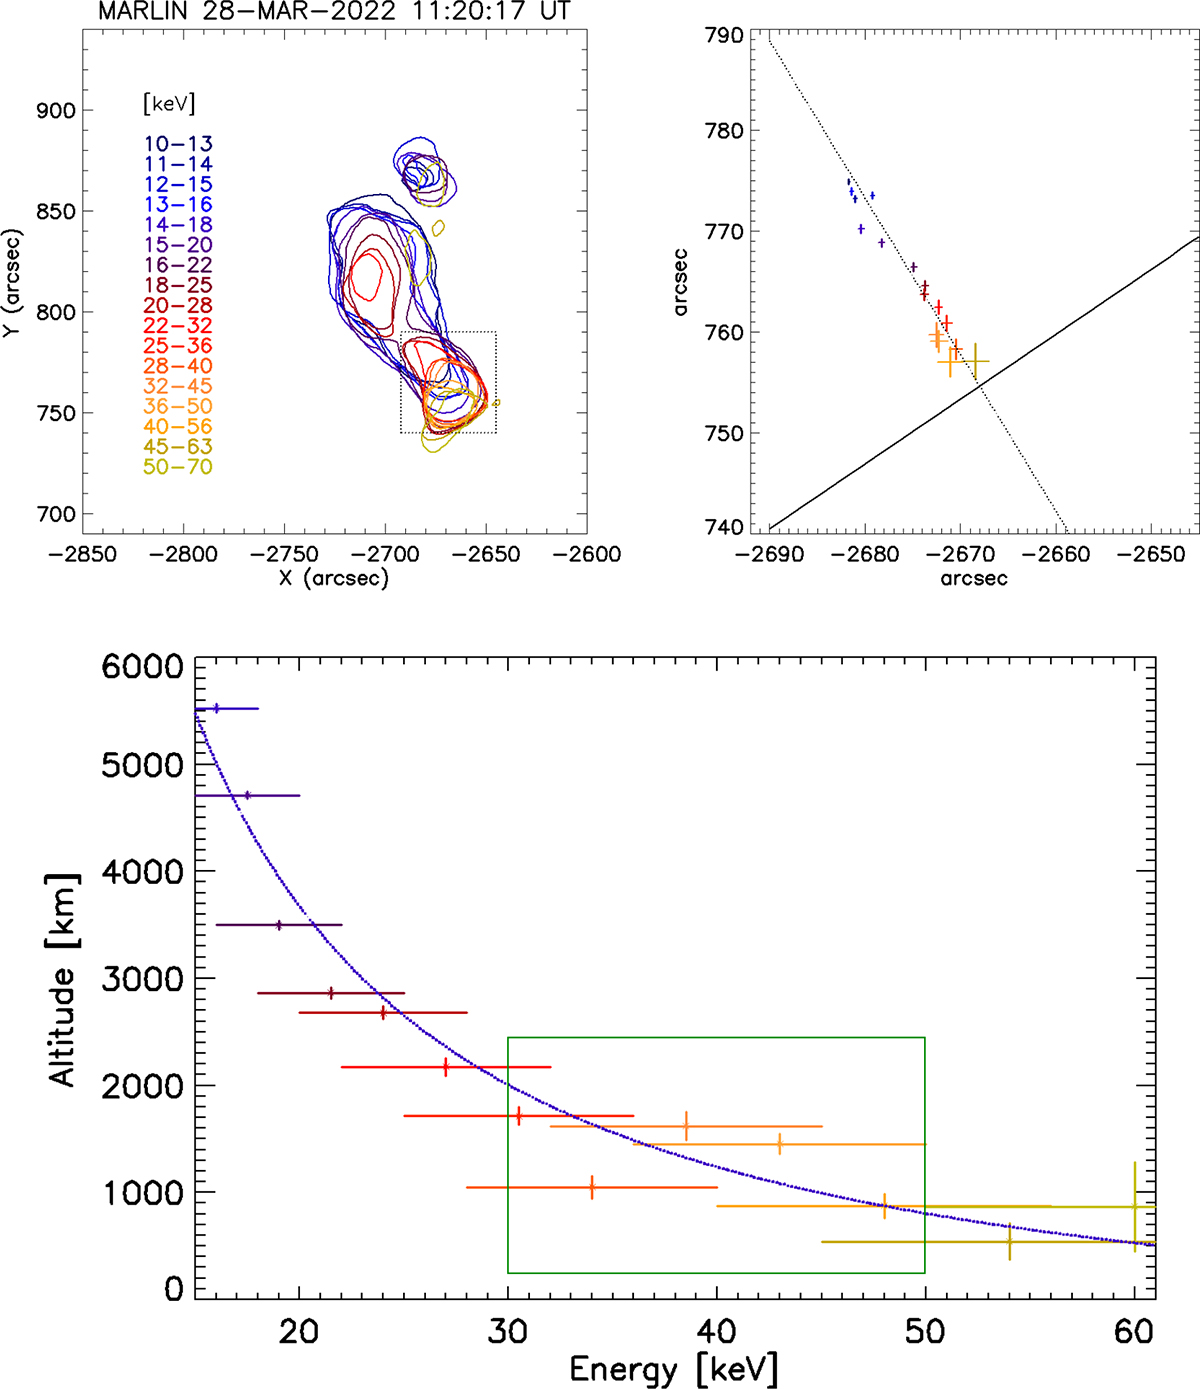
Fig. 4.
Download original image
Top-left: Contours of STIX images reconstructed for time interval 11:21:06–11:22:06 UT. Top-right: centroids of sources within a dotted box on the left panel. Linear fits to positions and perpendicular preliminary reference levels are marked accordingly. Energy is color-coded the same way on both panels. Bottom: Energy-altitude relation obtained for points marked in Figure 4. The altitudes have been estimated for corrected reference level, thus they are altitudes above the top of the photosphere. The bump is marked by green square.
Current usage metrics show cumulative count of Article Views (full-text article views including HTML views, PDF and ePub downloads, according to the available data) and Abstracts Views on Vision4Press platform.
Data correspond to usage on the plateform after 2015. The current usage metrics is available 48-96 hours after online publication and is updated daily on week days.
Initial download of the metrics may take a while.