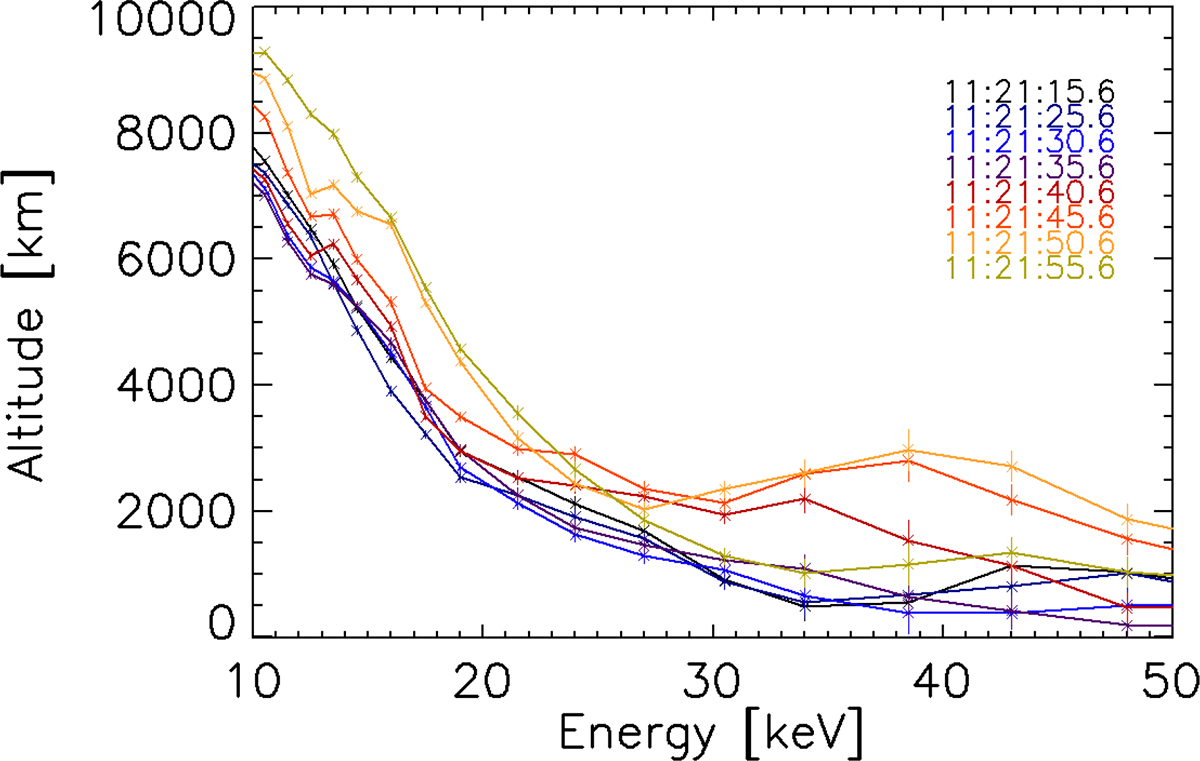
Fig. 5.
Download original image
Energy-altitude relations obtained for several time intervals extracted from interval 11:21:06–11:22:06 UT. Time is color-coded. Different evolutions for the chromospheric part end loop leg are visible. Plasma flows in the leg are more gradual, without abrupt changes in velocity. In the chromosphere region, violent reactions to electron beams are visible.
Current usage metrics show cumulative count of Article Views (full-text article views including HTML views, PDF and ePub downloads, according to the available data) and Abstracts Views on Vision4Press platform.
Data correspond to usage on the plateform after 2015. The current usage metrics is available 48-96 hours after online publication and is updated daily on week days.
Initial download of the metrics may take a while.