Fig. 5.
Download original image
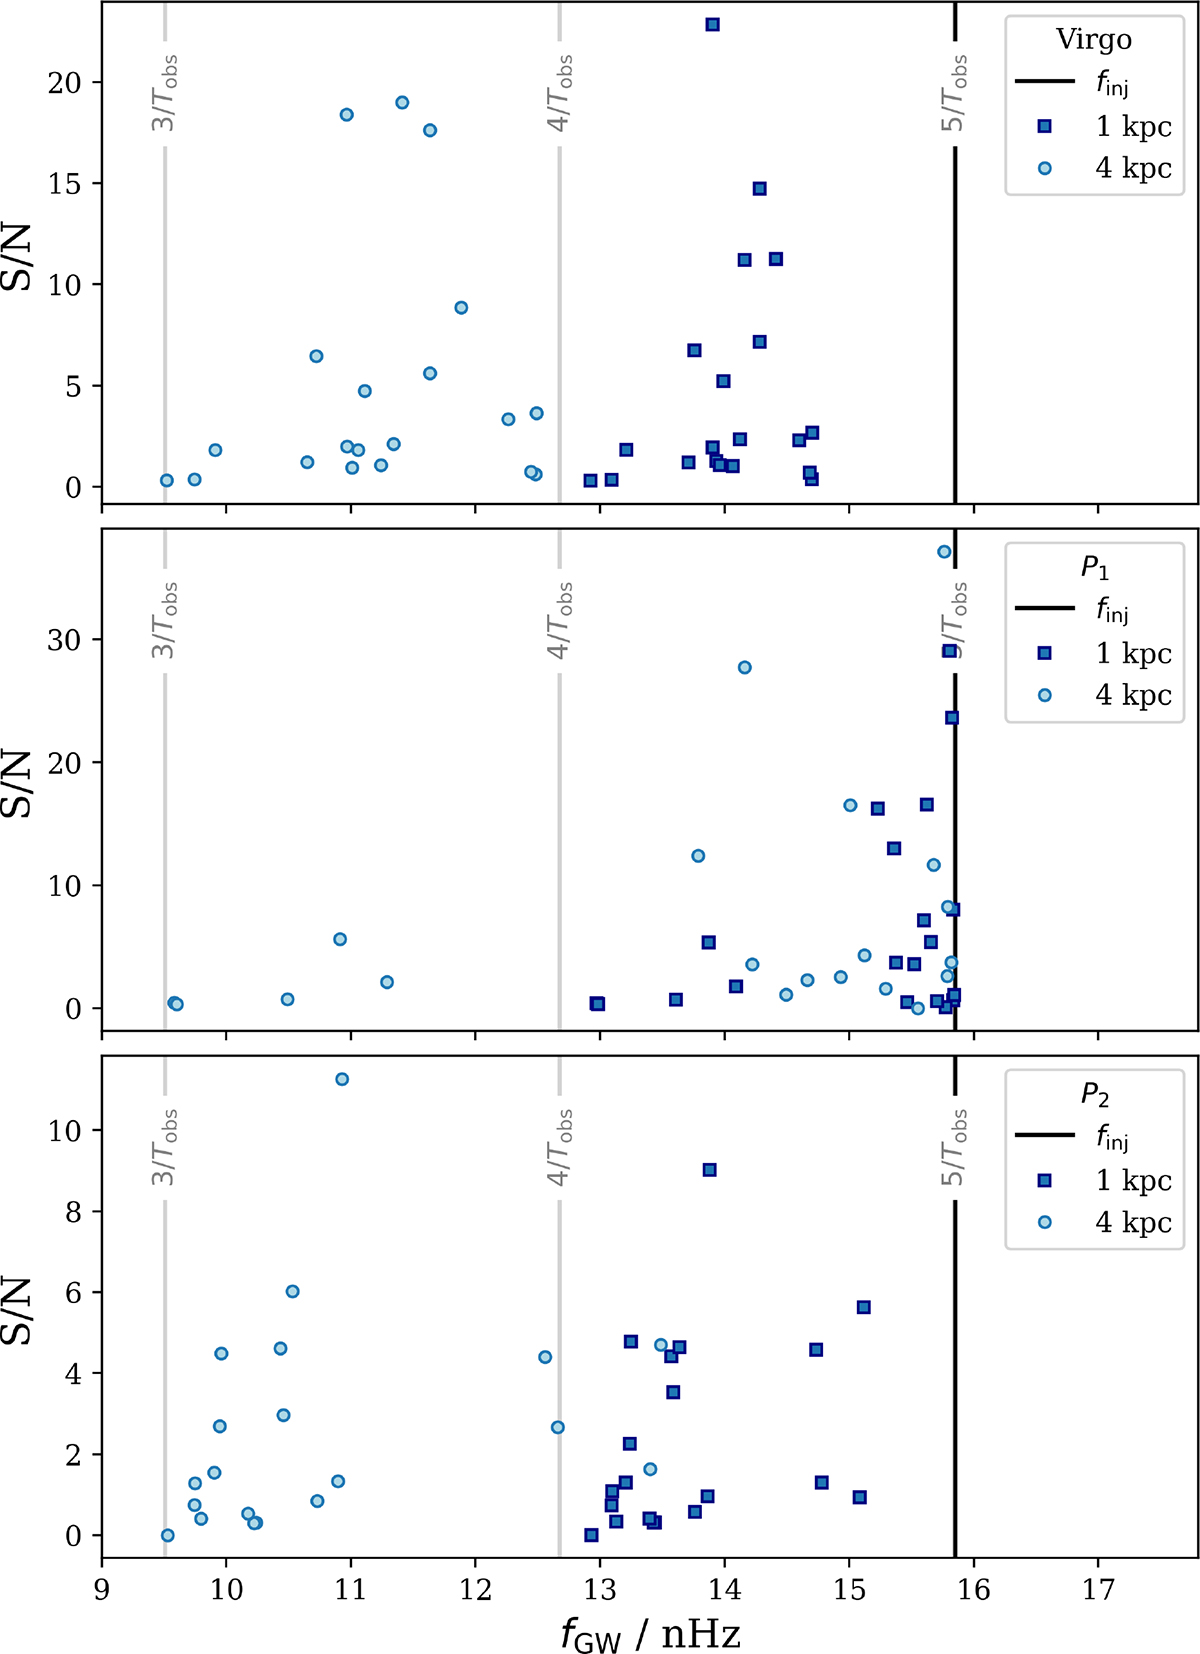
Distribution of PT frequencies vs. S/N contribution in the EPTA20 dataset for three different CGW source positions and pulsars at 1 kpc (dark blue squares) and 4 kpc (light blue dots). The CGW frequency (ET frequency) is indicated as the vertical dark blue line. The fundamental frequencies of the PTA with Tobs = 10 yr are indicated with the vertical grey lines and labels. Top: Virgo cluster. Middle: P1 = (RA 18 h, Dec −22.5 deg). Bottom: P2 = (RA 3 h, Dec −45 deg). Due to the dependence of the strain on the angular distance between the pulsar and the source (cf. Eq. (5)), the S/N varies across the three positions.
Current usage metrics show cumulative count of Article Views (full-text article views including HTML views, PDF and ePub downloads, according to the available data) and Abstracts Views on Vision4Press platform.
Data correspond to usage on the plateform after 2015. The current usage metrics is available 48-96 hours after online publication and is updated daily on week days.
Initial download of the metrics may take a while.