Open Access
Fig. 8.
Download original image
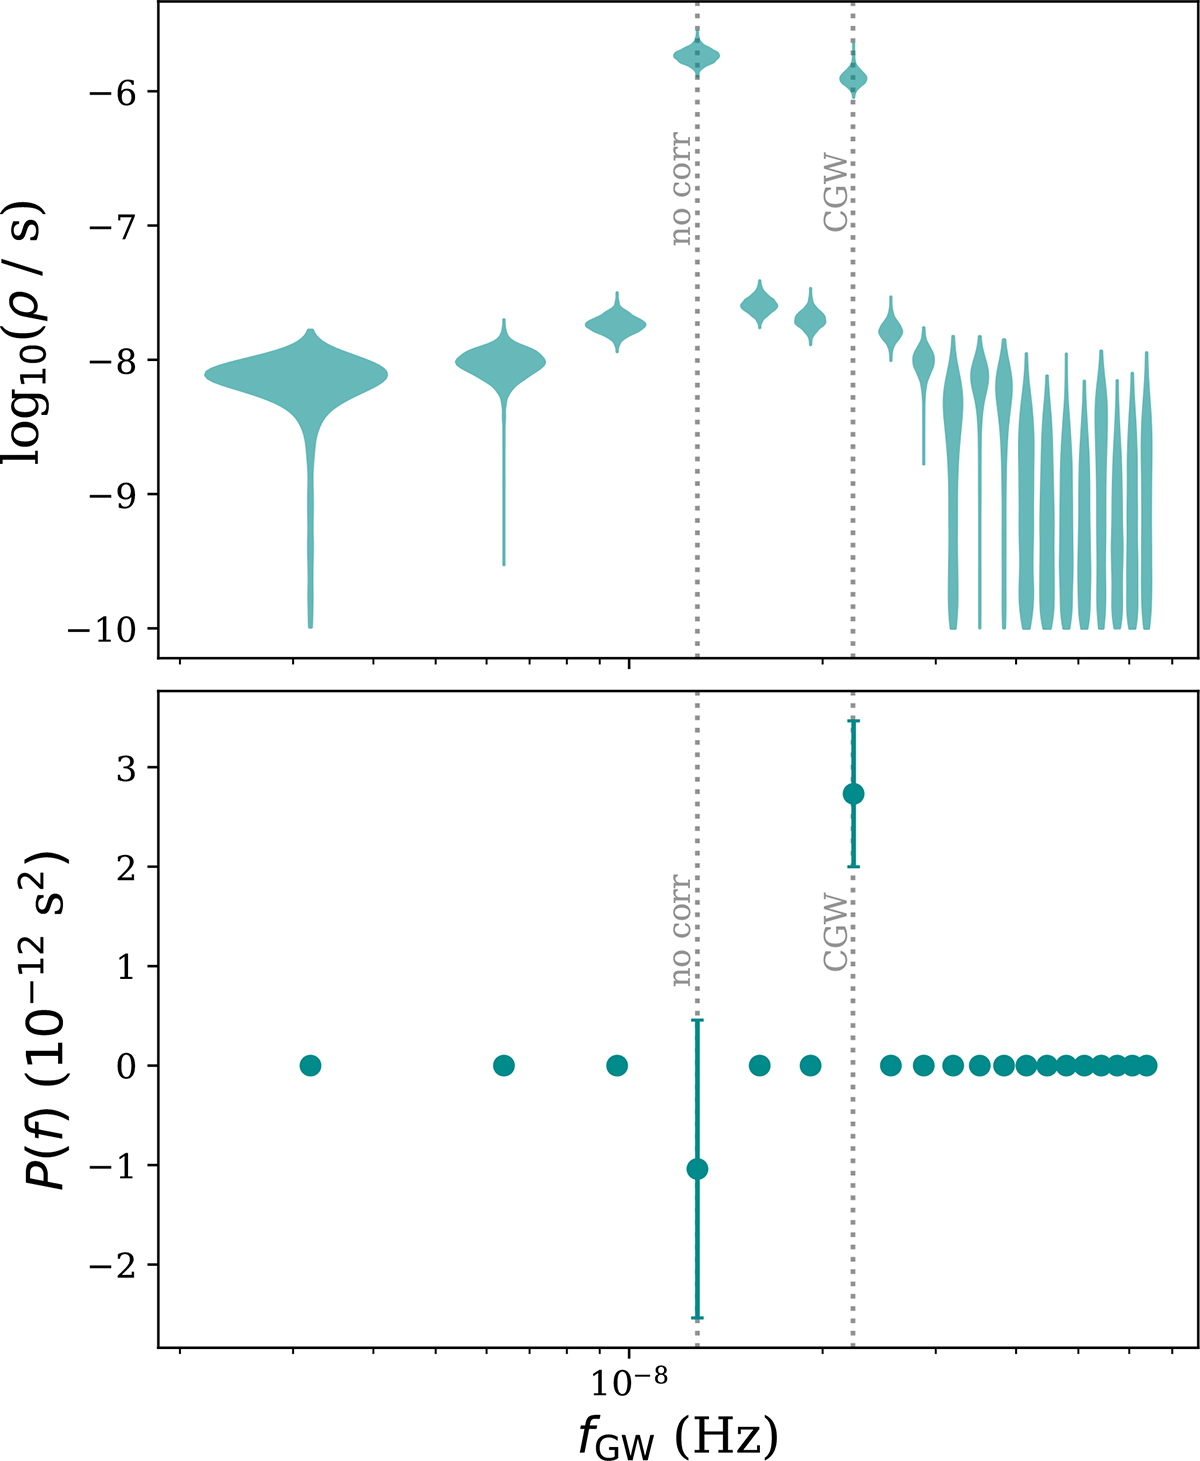
Comparison between a free spectrum and optimal statistic analysis at hand of a simulated dataset with an injection of a CGW and a single bin uncorrelated CRN. Upper plot: Free spectrum. Lower plot: Per-frequency OS.
Current usage metrics show cumulative count of Article Views (full-text article views including HTML views, PDF and ePub downloads, according to the available data) and Abstracts Views on Vision4Press platform.
Data correspond to usage on the plateform after 2015. The current usage metrics is available 48-96 hours after online publication and is updated daily on week days.
Initial download of the metrics may take a while.