Open Access
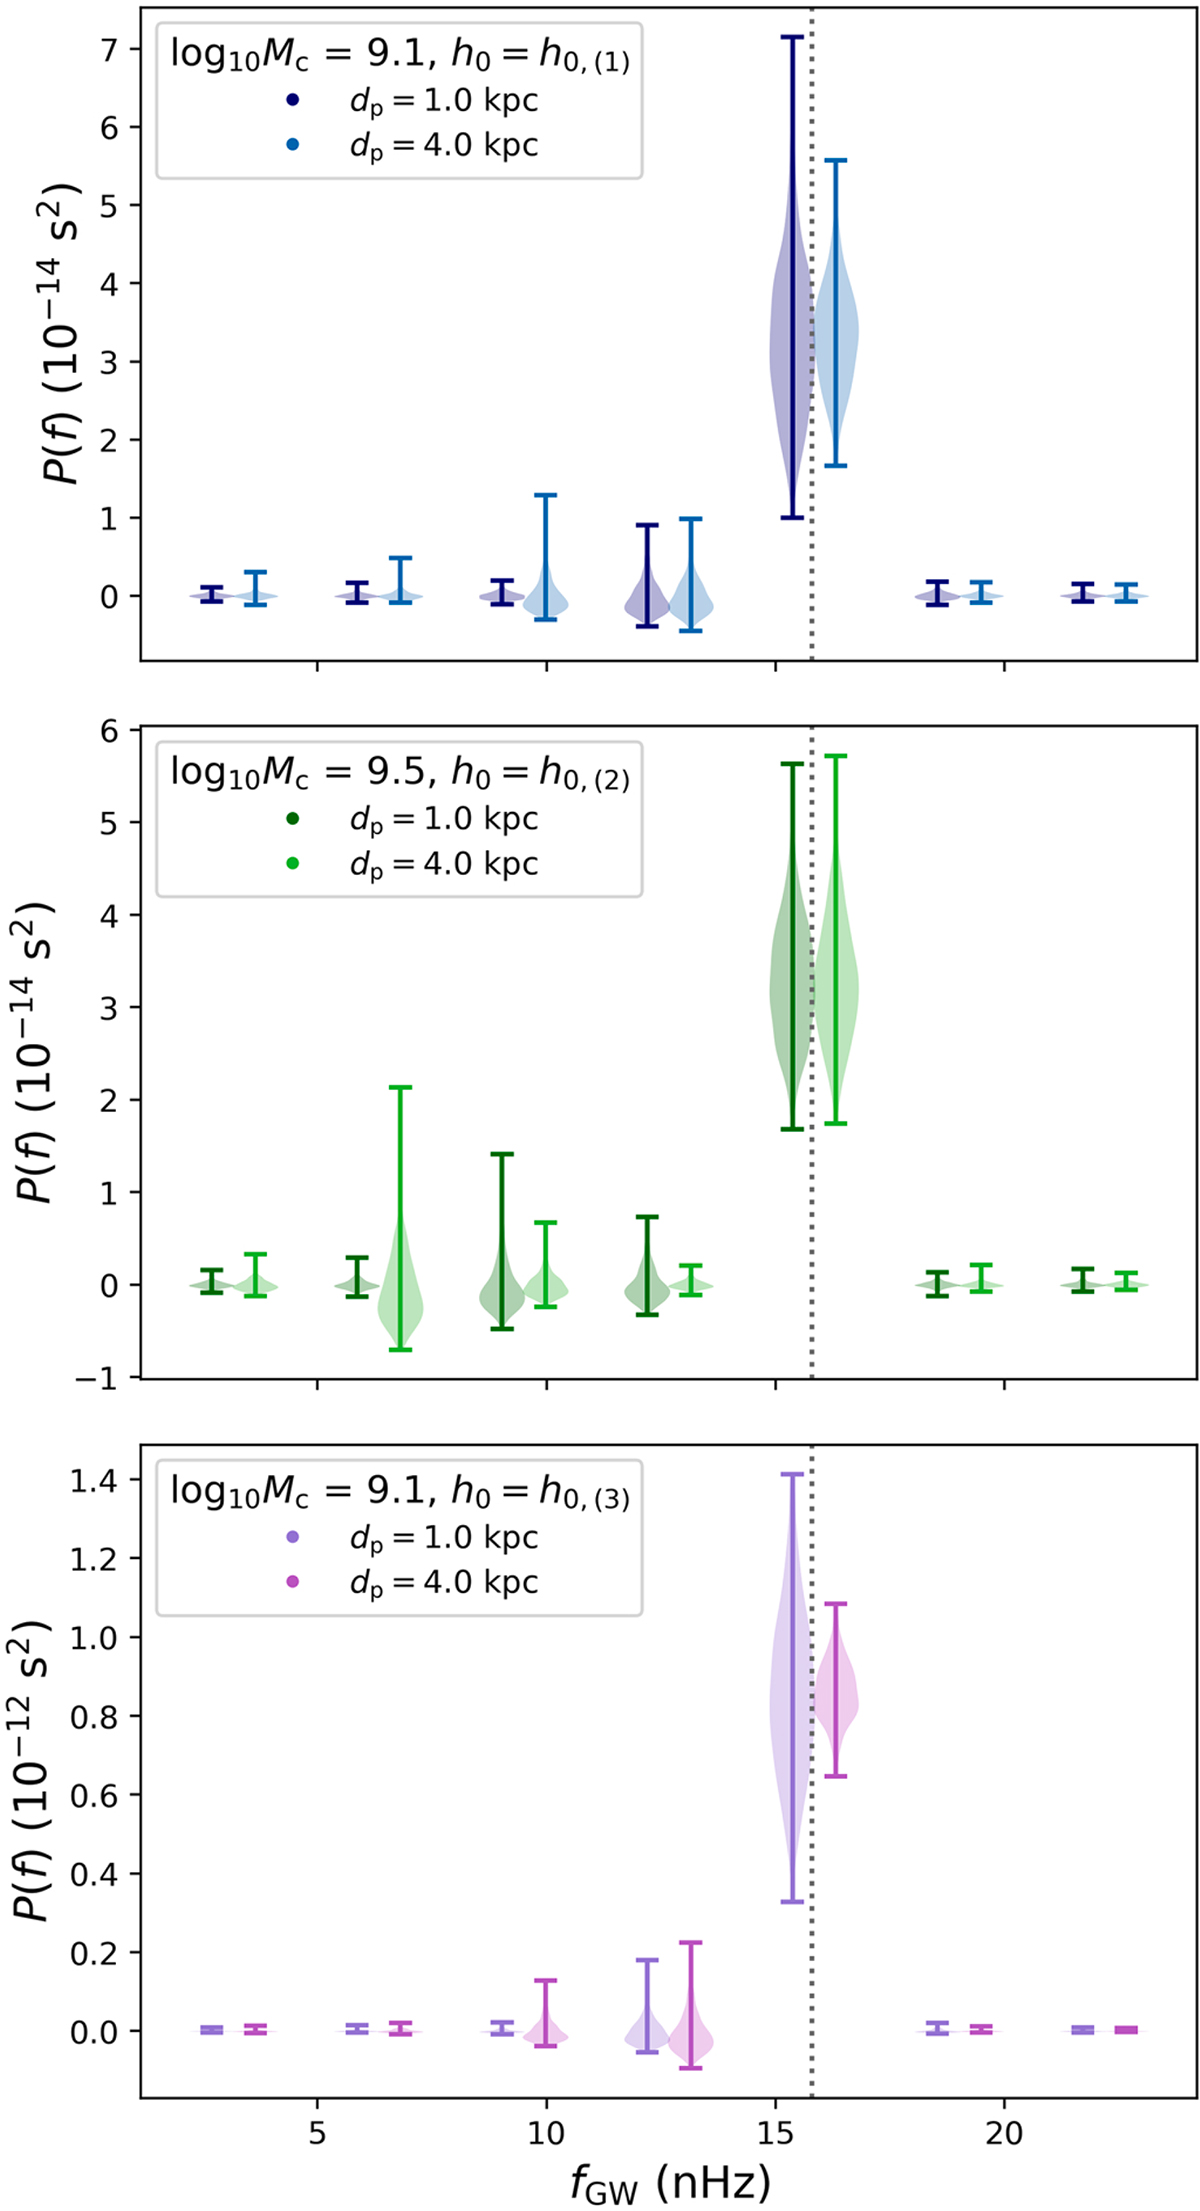
Fig. 9.
Download original image
Distribution of narrow-band PFOS values for 500 realisations of the EPTA20 PTA dataset at different average pulsar distances. Each point shows the PFOS estimator of the power spectrum amplitude at the respective frequency for a single dataset realisation. From top to bottom: Cases (1)–(3), as described in Sect. 2.3.
Current usage metrics show cumulative count of Article Views (full-text article views including HTML views, PDF and ePub downloads, according to the available data) and Abstracts Views on Vision4Press platform.
Data correspond to usage on the plateform after 2015. The current usage metrics is available 48-96 hours after online publication and is updated daily on week days.
Initial download of the metrics may take a while.