Fig. 2.
Download original image
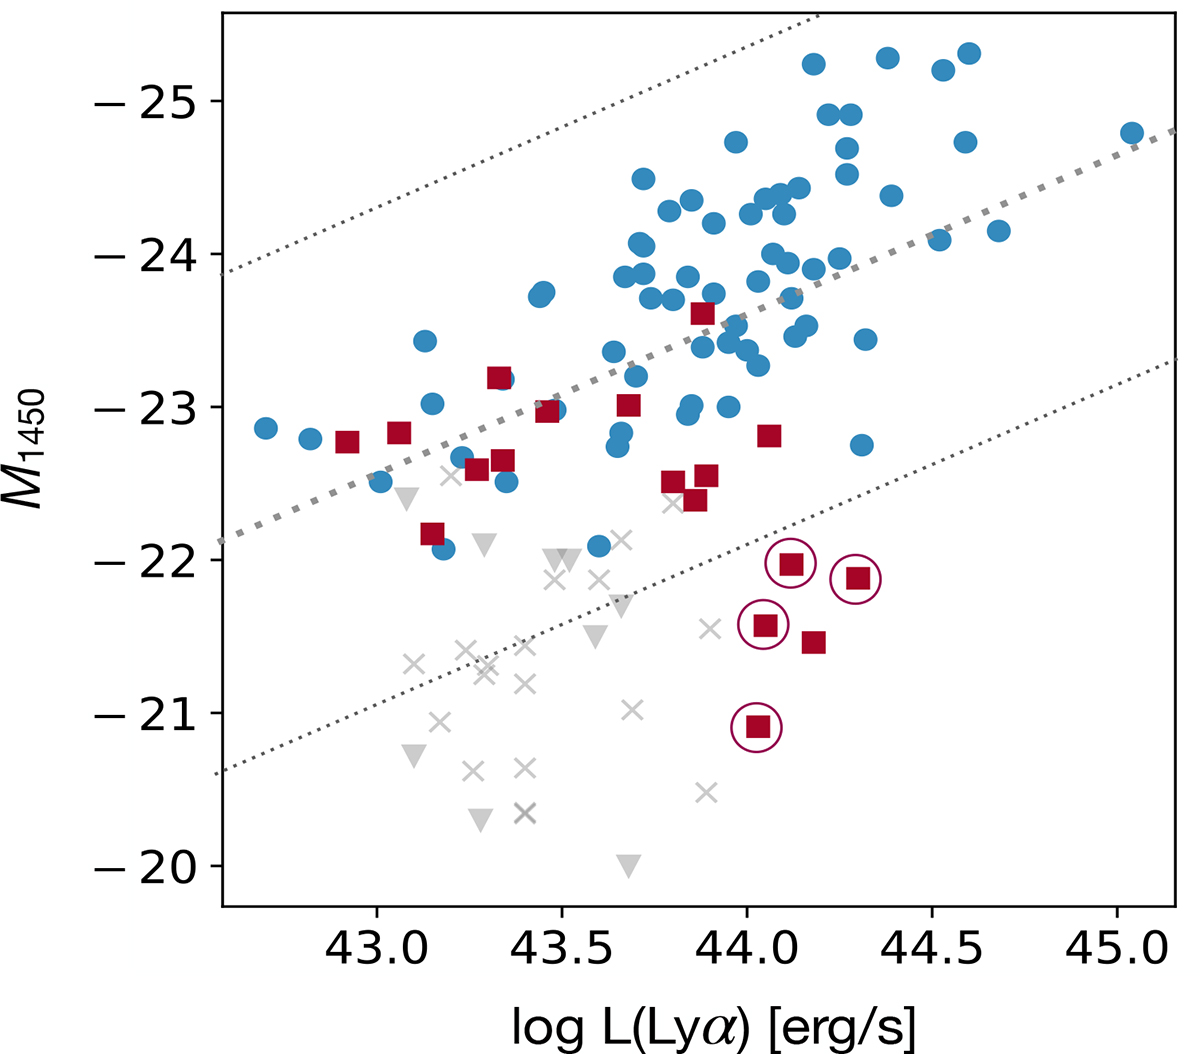
UV absolute magnitude, M1450, as a function of Lyα luminosity of SHELLQs quasars. Broad-line (FWHM(Lyα) ≥ 500 km s−1) and narrow-line (FWHM(Lyα) < 500 km s−1) objects are plotted with blue circles and red squares, respectively. The four Chandra targets are circled in red. The dashed line indicates the best linear fit to both broad- and narrow-line objects. The two dotted lines show the 95% compatible intervals. Data for LAEs at z ∼ 6 detected in the Subaru HSC survey from Shibuya et al. (2018) are also plotted in grey for comparison. Crosses are LAEs for which UV continuum emission was detected, while triangles are those for which only upper limits of UV emission were obtained.
Current usage metrics show cumulative count of Article Views (full-text article views including HTML views, PDF and ePub downloads, according to the available data) and Abstracts Views on Vision4Press platform.
Data correspond to usage on the plateform after 2015. The current usage metrics is available 48-96 hours after online publication and is updated daily on week days.
Initial download of the metrics may take a while.