| Issue |
A&A
Volume 706, February 2026
|
|
|---|---|---|
| Article Number | A305 | |
| Number of page(s) | 9 | |
| Section | Extragalactic astronomy | |
| DOI | https://doi.org/10.1051/0004-6361/202555410 | |
| Published online | 17 February 2026 | |
Subaru High-z Exploration of Low-Luminosity Quasars (SHELLQs)
XXII. Chandra observations of narrow-line quasar candidates at z ≥ 6
1
Institut de Ciències del Cosmos (ICCUB), Universitat de Barcelona (IEEC-UB), Martí i Franquès 1 08028 Barcelona, Spain
2
ICREA Pg. Lluís Companys 23 08010 Barcelona, Spain
3
INAF – Osservatorio di Astrofisica e Scienza dello Spazio di Bologna Via Gobetti 93/3 I-40129 Bologna, Italy
4
Research Center for Space and Cosmic Evolution, Ehime University 2-5 Bunkyo-cho Matsuyama Ehime 790-8577, Japan
5
Waseda Institute for Advanced Study (WIAS), Waseda University, 1-21-1 Nishi-Waseda Shinjuku Tokyo 169-0051, Japan
6
Kavli Institute for the Physics and Mathematics of the Universe (Kavli IPMU, WPI), UTIAS, Tokyo Institutes for Advanced Study, University of Tokyo Chiba 277-8583, Japan
7
Department of Astrophysical Sciences, Princeton University 4 Ivy Lane Princeton NJ 08544, USA
8
Department of Astronomy, School of Science, The University of Tokyo 7-3-1 Hongo Bunkyo Tokyo 113-0033, Japan
9
Department of Physical Sciences, Ritsumeikan University Kusatsu Shiga 525-8577, Japan
10
Academia Sinica Institute of Astronomy and Astrophysics, 11F Astronomy-Mathematics Building, AS/NTU, No. 1, Section 4 Roosevelt Road Taipei 10617, Taiwan
11
Kavli Institute for Astronomy and Astrophysics, Peking University Beijing 100871, China
12
Department of Physics, Graduate School of Science Tokyo Metropolitan University Hachioji-shi Tokyo 192-0397, Japan
13
National Astronomical Observatory of Japan, Osawa Mitaka Tokyo 181-8588, Japan
14
Institute of Astronomy, Graduate School of Science, The University of Tokyo 2-21-1 Osawa Mitaka Tokyo 181-0015, Japan
15
Research Center for the Early Universe, Graduate School of Science, The University of Tokyo Hongo Tokyo 113-0033, Japan
16
Department of Astronomy, Kyoto University Sakyo-ku Kyoto, Japan
★ Corresponding author: This email address is being protected from spambots. You need JavaScript enabled to view it.
Received:
6
May
2025
Accepted:
17
December
2025
Abstract
We report on Chandra X-ray observations of four narrow-line quasar candidates at z ∼ 6, selected from the Subaru high-z exploration of low-luminosity quasars (SHELLQs) project, based on the Subaru Hyper Suprime-Cam survey. These objects are characterised by narrow (FWHM ≤ 310 km s−1), luminous (> 1044 erg s−1) Lyα, and faint UV continuum (M1450 = −22 to −21), prompting us to examine whether they are obscured luminous active galactic nuclei (AGNs) at the epoch of reionization. However, none of these objects were detected by Chandra, giving an upper limit to their rest-frame 2−10 keV luminosity (LX) of 2 × 1044 erg s−1 (2σ), assuming a spectral slope of Γ = 2. Subsequent rest-frame optical spectroscopy of these objects by the James Webb Space Telescope, presented in a companion paper, shows weak broad Balmer emission at the base of narrow cores. With the scaling relation for low-redshift AGNs, the observed strong [O III]λ5007 flux of these sources would predict LX to be around 1045 erg s−1, which is well above the Chandra upper limits. These optical spectra and X-ray quietness are reminiscent of JWST-selected broad-line AGNs. We attribute the weak broad Balmer emission to the broad-line regions hidden partially by optically thick obscuring matter that also hides the optical and X-ray continuum emission from the accretion disc. Compton-thick obscuration, which would strongly suppress X-ray emission, could be due to a dense interstellar medium that is often present in galaxies at high redshifts. Alternatively, the same effect could be obtained from an inflated disc at the innermost radii in a supercritical accretion flow, when the disc is viewed at inclined angles.
Key words: galaxies: active / galaxies: high-redshift / X-rays: galaxies
© The Authors 2026
 Open Access article, published by EDP Sciences, under the terms of the Creative Commons Attribution License (https://creativecommons.org/licenses/by/4.0), which permits unrestricted use, distribution, and reproduction in any medium, provided the original work is properly cited.
This article is published in open access under the Subscribe to Open model. This email address is being protected from spambots. You need JavaScript enabled to view it. to support open access publication.
1. Introduction
Both X-ray surveys and theoretical studies indicate that obscuration of active galactic nuclei (AGNs) increases towards higher redshift, and the obscured AGN fraction at z > 4 could be as high as 80−90% (Gilli et al. 2022; Ni et al. 2020; Davies et al. 2019; Trebitsch et al. 2019; Vito et al. 2018; Liu et al. 2017). X-ray observations prove to be an useful tool in searching for obscured AGNs, owing to the penetrating nature of X-rays (e.g. Hickox & Alexander 2018). The search for obscured quasars at high redshift is helped by the negative k correction of an absorbed X-ray spectrum, unless the obscuration is heavily Compton-thick. In the absence of broad emission lines, optical-UV AGN signatures indicating a powerful ionising source, together with X-ray detection, would give a convincing case for obscured AGNs. Despite the expected abundance of obscured AGNs at high redshift, few examples showing both AGN narrow emission-line features and powerful X-ray emission have been found.
The ‘Subaru High-z Exploration of Low-Luminosity Quasars’ (SHELLQs) project (Matsuoka et al. 2016) searches for quasars in the redshift range of z > 5.6, based on the Hyper Suprime-Cam (HSC, Miyazaki et al. 2018) Subaru Strategic Program (SSP) wide-field imaging survey (Aihara et al. 2018). The majority of these quasars lie in the intermediate luminosity range between those discovered by earlier works based on shallower surveys (e.g. Fan et al. 2006; Willott et al. 2005; Jiang et al. 2015) and faint broad-line AGNs including little red dots (LRDs), recently found by James Webb Space Telescope (JWST) spectroscopy (e.g. Harikane et al. 2023; Übler et al. 2023; Greene et al. 2024; Matthee et al. 2024; Maiolino et al. 2024; Juodžbalis et al. 2024; Wang et al. 2024; Schindler et al. 2025; Furtak et al. 2024; Kocevski et al. 2025). The SHELLQs quasars in this luminosity range are quite rare, requiring a sensitive survey over the large area ∼1000 deg2 of the Subaru HSC SSP to be discovered. The SHELLQs quasars include 18 faint objects with luminous narrow Lyα (Matsuoka et al. 2018a,b, 2019). They are characterised by their Lyα line widths and luminosities: full width at half maximum (FWHM) < 500 km s−1 (see the cumulative density function (CDF) of FWHM(Lyα) in Fig. 1) and L(Lyα) > 1 × 1043 erg s−1 (Matsuoka et al. 2018b). It has been known that Lyα emitters (LAEs) exceeding this luminosity are dominated by AGNs (Konno et al. 2016; Sobral et al. 2018). Similar narrow-line quasar candidates have been discovered at lower redshifts (e.g. Alexandroff et al. 2013), but few were known at z ∼ 6 (Willott et al. 2009; Kashikawa et al. 2015). Some of the SHELLQs narrow-line objects have L(Lyα) exceeding 1044 erg s−1, more luminous than any known star-forming LAEs, whereas they show faint UV continuum emission, consistent with galaxy light with M1450 ≥ −22. These objects can be considered as good obscured AGN candidates. Keck-MOSFIRE near-infrared spectroscopy of one of the narrow-line objects, J142331.71–001809.1, revealed the narrow C IV doublet λλ1548, 1550 with a rest-frame equivalent width, EW, of ≃37 Å (Onoue et al. 2021). Since the maximum EW of C IV expected in star-forming galaxies is 10 Å (Nakajima et al. 2018), this strongly suggests the presence of hard ionising photons from an AGN.
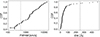 |
Fig. 1. Line widths (FWHM) and rest-frame EWs of Lyα of SHELLQs quasars. Left panel: CDF of FWHM(Lyα) in units of kilometres per second. Seven objects show unresolved lines that have an upper limit on FWHM of 230 km s−1. The dotted line indicates the dividing line at 500 km s−1 below which narrow-line objects are defined. Right panel: CDF of EW(Lyα). The dotted line indicates 250 Å, above which five outliers in Fig. 2, including the four Chandra targets, are found. |
Here we describe X-ray observations of four of these narrow-line objects with the Chandra X-ray Observatory (Chandra hereafter), which resulted in no detection. Combined with results of recently acquired JWST rest-frame optical spectra of these objects that show broad Balmer lines (Matsuoka et al. 2025), we conclude that these objects may be higher-luminosity versions of the JWST-selected AGNs, as they share similar properties. This paper is structure as follows. Sect. 2 describes the target selection, followed by the Chandra observations (Sect. 3) and the results (Sect. 4). Sect. 5 discusses implications of the results, including the JWST spectroscopy of the targets. We adopt the cosmological parameters H0 = 70 km s−1 Mpc−1, ΩM = 0.3, and ΩΛ = 0.7.
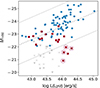 |
Fig. 2. UV absolute magnitude, M1450, as a function of Lyα luminosity of SHELLQs quasars. Broad-line (FWHM(Lyα) ≥ 500 km s−1) and narrow-line (FWHM(Lyα) < 500 km s−1) objects are plotted with blue circles and red squares, respectively. The four Chandra targets are circled in red. The dashed line indicates the best linear fit to both broad- and narrow-line objects. The two dotted lines show the 95% compatible intervals. Data for LAEs at z ∼ 6 detected in the Subaru HSC survey from Shibuya et al. (2018) are also plotted in grey for comparison. Crosses are LAEs for which UV continuum emission was detected, while triangles are those for which only upper limits of UV emission were obtained. |
2. Target selection
2.1. Lyα properties
We selected Chandra targets from among the 18 SHELLQs narrow-line quasar candidates discovered as of Matsuoka et al. (2019). Fig. 2 show the M1450 − L(Lyα) diagram of SHELLQs quasars, divided into broad-line (FWHM ≥ 500 km s−1) and narrow-line objects (Fig. 1). A loose correlation between the line and continuum luminosities can be seen. There are five objects that lie more than 2σ from the linear fit to M1450 against log L(Lyα) for the full SHELLQs sample1. The five outliers happen to have the largest Lyα luminosities among the narrow-line objects. The high EW of Lyα is consistent with a suppressed UV continuum in an obscured AGN. As is shown in Fig. 2, they might be objects at the extreme end in luminosity of the population of luminous LAEs at z ∼ 6 detected in the Subaru HSC survey (Shibuya et al. 2018), which could also contain AGNs. We thus selected these five objects as possible obscured AGN candidates.
Due to the limited observing time awarded for this program, one of the candidates, J114658.96–000537.6 (z = 6.30), was left out and the other four objects were observed with Chandra. Table 1 gives rest-frame UV properties of the four targets. We refer these objects as G01, G02, G03, and G04 hereafter, as given in the companion paper on JWST results by Matsuoka et al. (2025). They have Lyα emission with luminosities exceeding 1044 erg s−1 and EW ranging between 280 Å and 470 Å in the rest frame (Table 1, Fig. 1).
Chandra targets.
The mean line profile of Lyα of the four objects, obtained from the Subaru-FOCAS (Matsuoka et al. 2019), which was constructed after normalising the spectra by the line peak, is shown in Fig. 3. The line profile of this composite shows a weak red-wing (the line profile bluewards is absorbed by the Lyα forest). This wing component has a FWHM of ∼2000 km s−1 (detailed fits of the line profiles of individual objects are presented in Matsuoka et al. 2025). Although this broad component could be attributed to the broad-line region (BLR) of an AGN, other causes such as an outflow and resonant scattering (e.g. Osterbrock 1962) might be in play. We note that there is no clear sign of N Vλ1240 Å with a P Cygni profile, seen in the composite spectrum of all SHELLQs narrow-line objects presented in Matsuoka et al. (2019).
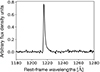 |
Fig. 3. Mean Lyα profile of the four Chandra targets. |
The observed UV continuum luminosities of these objects are all fainter than M1450 = −22, and thus can be attributed to galaxy emission alone, as the number density of galaxies is about three orders of magnitude above that of unobscured quasars at z ∼ 6, suggested by their respective luminosity functions (Matsuoka et al. 2018c).
2.2. X-ray detection experiment
The observation of the Lyα emission line was the only clue we had before the X-ray observations as to how powerful possible AGNs in these sources might be. Its luminosity can be a rough guide of AGN luminosity: although statistically there is a positive correlation between the luminosities of Lyα and X-ray in AGNs (Calhau et al. 2020), the scatter of the correlation and sparse sampling of the large Lyα luminosity range mean that L(Lyα) is not a reliable LX predictor for an individual object. We therefore took an alternative route and predicted their LX based on their surface density, as is described below, and designed the Chandra observations as a detection experiment in which only a few source counts are expected.
Five obscured AGN candidates that are outliers of the M1450 − L(Lyα) correlation (Sect. 2.1) were found in the survey area of 900 deg2. Suppose obscured AGNs outnumber unobscured AGNs by a factor of β, and the obscuration-corrected luminosity function of obscured AGNs has the same shape as that of the known quasars at z ∼ 6 of Matsuoka et al. (2018c). We assume β to be in the range of 1 to 10, which is equivalent to an AGN obscured fraction of fobsc = 0.5 − 0.91. The lower bound corresponds to the limit of obscuration caused only by circumnuclear hot dust found in quasars at z ∼ 2 (Lusso et al. 2013). The higher bound matches the value of fobsc > 0.82 derived from the proximity zone analysis for z > 7 quasars by Davies et al. (2019). Given this hypothetical luminosity function, one can obtain a luminosity that yields the observed surface density. For the two extreme values of β, the UV absolute magnitudes to yield five objects per 900 deg2 are M1450 ≃ −25.7 (β = 1) and M1450 ≃ −27.7 (β = 10). Using the known luminosity-dependent UV to X-ray relation (Vito et al. 2019), the corresponding rest-frame 2−10 keV luminosities, LX, are 4 × 1044 erg s−1 (β = 1) and 1.3 × 1045 erg s−1 (β = 10). If the targets emit at luminosity in the above range and have a power-law spectrum of photon index Γ = 2, source counts expected in the 1−5 keV band for a 60 ks Chandra ACIS-S observation range from five to 15 counts for z = 6.1, even if the equivalent hydrogen absorbing column density of obscuration is as large as NH ∼ 1023 cm−2.
3. Observations
Chandra observations of the four SHELLQs narrow-line objects were carried out during the Cycle 23. Each target was observed with three or four exposures to achieve an integrated exposure time of approximately 60 ks, as is shown in Table 2. All the targets were placed on the ACIS-S3 chip, operating in the VFAINT mode. The Galactic absorption for each target ranges from NH = 1.4 × 1020 cm−2 to NH = 3.9 × 1020 cm−2, according to the HI4PI map (HI4PI Collaboration 2016). The Chandra ACIS detector of the current effective area is not sensitive to this amount of small Galactic absorption. Data reduction was performed in the standard manner using CIAO 4.15 (Fruscione et al. 2006).
Chandra observation log.
4. Results
X-ray images of each target were constructed by stacking the repeat exposures. The total exposure times are and 56.7 ks for G01, 56.5 ks for G02, 57.0 ks for G03, and 60.0 ks for G04, respectively. We examined those images in the 1−5 keV band, where the signal to noise ratio is expected to be optimal owing to low instrumental background. None of the targets were detected (Fig. 4). With the point spread function (PSF) of the ACIS-S, 60% of counts from a point source are expected to fall within a 1-pixel ( = 0.49″) radius (MARX document 5.2.2). No counts were observed within a 1-pixel radius from any of the four target positions. The background counts in the 1−5 keV band are 0.013−0.015 cts pixel−1 for these observations. Therefore no background count is expected (the probability of observing one or more background counts in the area is 4%), as observed. The detection of no counts sets the 95% upper limit to be 3 counts in each aperture, using a Bayesian formulation for a Poisson distribution of counts (Kraft et al. 1991). Assuming that each source has a photon-index of Γ = 2 (e.g. Huang et al. 2020) and absorbing column of NH < 1023 cm−2, the corresponding rest-frame 2−10 keV luminosity at the median redshift of the four targets, z = 6.13, is 2 × 1044 erg s−1, which we adopted as the upper limit of each object for the discussion below.
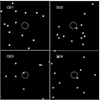 |
Fig. 4. Chandra 1−5 keV images of the four narrow-line SHELLQs quasars. Each panel is a 15″ × 15″ field of view centred on the target. The image orientation is north up, east to the left. The circle indicates the optical position with a 1 arcsec radius. |
We note that one count was registered at 0.8 arcsec (within a 2-pixel radius) from the target position in the G03 image. Given the PSF, the probability of detecting one source count in the second radial pixel but none in the first is 10%. Given the background level, observing one background count within the same area has a probability of 12%, assuming a Poisson process. Since the Bayes factor is around unity, no preference is given whether it is a source or background count. Even if it is a source count, the one count does not constitutes a detection, but gives an increased upper limit of 4.7 counts for G03, corresponding to 3 × 1044 erg s−1.
If the spectral slope differs from Γ = 2 and the absorbing column NH is larger than 1023 cm−2, the upper limit of intrinsic (unabsorbed) LX will be different. Fig. 5 shows the 95% upper limits on LX corresponding to 3 counts, when the photon index is Γ = 1.6, 2.0 or 2.4, as a function of the absorbing column density, NH.
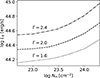 |
Fig. 5. Upper limit of intrinsic LX corresponding to three counts (the 95% upper limit obtained from a 60 ks exposure) for a different assumed spectral slope, Γ. LX is the unabsorbed, rest-frame 2−10 keV luminosity. Examples for three values of photon index, Γ = 1.6 (dotted line), 2.0 (dashed line), or 2.4 (dash-dotted line), as a function of NH are shown. |
We have four targets with approximately equal exposure times. If our four targets have similar X-ray luminosities, as in the case for Lyα – the mean is 1044.1 erg s−1 and the standard deviation in the log is only 0.1 – their average X-ray luminosity can be constrained by stacking all the observations. When a 2-pixel radius around the target position is adopted and the one count registered in all the observations is considered, a 95% upper limit of 1.0 count per object is obtained following the formulations of Weisskopf et al. (2007). For Γ = 2, this corresponds to LX = 0.8 × 1044 erg s−1, which we consider to be the upper limit of the average LX from stacking.
5. Discussion
The fact that we did not detect X-rays from these sources raises the possibility that these objects are not AGNs and that star formation is responsible for the luminous Lyα. If that were the case, they would have a low metallicity of Z < 0.01 Z⊙ and a young age (less than 106 yr) of intense star formation (Hashimoto et al. 2017), since normal star-forming galaxies cannot produce EW(Lyα) > 240 Å (Malhotra & Rhoads 2002). However, recently acquired JWST spectra of the Chandra targets favour the presence of an AGN for all four objects (Matsuoka et al. 2025). We briefly discuss the implications of the JWST results and, if AGNs exist, how their X-ray emission remains below the detection limit.
5.1. Selection bias
One of the selection criteria of quasar candidates from the Subaru HSC imaging data is that a candidate source should be point-like2 (Matsuoka et al. 2018b), which optimises the original purpose of selecting unobscured quasars in which AGN emission dominates the rest-frame UV light. On the other hand, the HSC image of an obscured AGN is primarily due to emission from the host galaxy, and thus could be extended. This would mean that some obscured AGN candidates would be missed, and the true number of obscured quasars could be larger than actually discovered under the adopted criteria. In Sect. 2.2, we made the crude estimate of the typical LX of our Chandra targets using the targets’ surface density and an assumed luminosity function as a function of the ratio of obscured to unobscured AGNs (β = 1 − 10). The possible underestimate of obscured quasars mentioned above would then lower the typical luminosity of the obscured quasars that can be selected in the Subaru HSC survey. This could be consistent with no detection of the Chandra targets, but a question is the extent to which we missed obscured quasars.
The upper limit value of the average luminosity for our Chandra targets obtained above (corresponding to M1450 ∼ −24) gives a number of obscured quasars five times larger for β = 1 or ∼100 times larger for β = 10 than those selected for our Chandra observations (that is, five, including the one left out), using the shape of the luminosity function of Matsuoka et al. (2018c). Given the negative slope of the luminosity function, these are lower limits of the obscured quasar number. While missing a factor of four more obscured quasars by applying the point source criterion, as found for β = 1, might just be possible, missing by ∼100 times more objects (β = 10) seems unlikely. On the other hand, a large value of β, close to β = 10, is generally favoured, as is argued in Sect. 1. This means that the selection bias against obscured quasars is insufficient by a large margin to explain the null X-ray detection.
5.2. Implications from JWST spectroscopy
5.2.1. Broad Balmer emission
Rest-frame optical spectra of the four Chandra targets were obtained using JWST-NIRSpec during Cycle-2 (Program ID 3417). All four spectra show weak broad Balmer emission with FWHM ∼ 2000 km s−1 at the base of narrow lines, reminiscent of those of JWST-selected AGNs. Detailed results are presented in Matsuoka et al. (2025). Here we present an extract of emission-line properties relevant to this work in Table 3. Extinction was derived from Balmer decrements of narrow and broad components separately, and luminosities were corrected for the corresponding extinctions. As broad emission is seen both in Hα and Hβ, they resemble optical spectra of Seyfert 1.8 (Osterbrock 1977, although J1254–0014 with stronger broad emission than the others barely qualifies as Seyfert 1.5 when the criterion of Winkler 1992 is applied). A straightforward interpretation of the broad Balmer emission is that it originates from the BLRs of AGNs.
Results from JWST-NIRSpec observations.
5.2.2. Obscured BLRs and continuum source
The Balmer line profiles with a strong narrow core shows that the broad emission in these objects is systematically weaker than those of typical broad-line quasars. In addition to small to moderate extinction for the narrow-line regions (NLRs), the visibility of broad Hβ means that extinction for the BLRs cannot be large and is insufficient to suppress the broad Hα as observed (Table 3). This implies that either the BLR emission is intrinsically weak, or only part of the BLRs is visible. The former could occur for a low Eddington ratio, λEdd < 10−2 (e.g. Elitzur & Ho 2009; Kang et al. 2025). However, in this case, it would be accompanied by a hard SED; that is, X-ray emission that is strong relative to UV (Ferland et al. 2020). Since this does not match the observations, this hypothesis seems unlikely. Moreover, given the high bolometric luminosities (see Fig. 7) their inferred black hole masses would be close to or in excess of 1010 M⊙, which is unlikely at z ∼ 6 (e.g. Wu et al. 2015). More probable is the latter model, in which the bulk of the BLRs is totally hidden. If an optically thick obscuring torus is present, a part of the BLRs can be hidden at intermediate viewing angles, and the strength of broad-line emission depends on the visiblility of the BLR clouds.
We next make a crude estimate of the total broad Hα luminosity and its visible proportion. For broad-line AGN at low redshift, Jin et al. (2012) found that the narrow component of Hα emission3 comprises, on average, 10 ± 8% of the total flux. Assuming the same composition, a broad component luminosity, L′(HαB), which includes the hidden portion, can be estimated, using the observed narrow Hα luminosity (Table 4). Comparing this estimate with the observed L(HαB) gives the fraction of the BLRs that is visible, fBLR, ranging from 9% to 52% (Table 4).
Correction for hidden BLRs and LX predictions.
The JWST spectra also show faint optical continuum emission. Given a broad Hα luminosity, the empirical relation of Greene & Ho (2005) gives a 5100 Å luminosity,  , with an uncertainty of ≃0.2 dex. The observed luminosity,
  (corrected for
  ), is expected to match that obtained from a broad Hα luminosity4,
  , or larger as there is a contribution from host galaxy light in the observed continuum. While two faint broad Balmer-line objects, G01 and G03, show comparable
  to the expected values, the G02 and G04 with stronger broad Balmer emission show
  fainter than expected (Fig. 6), suggesting that the AGN continuum is suppressed more than the BLR emission is. Although the Greene & Ho (2005) relation is based on Sloan Digital Sky Survey (SDSS) broad-line AGNs at lower redshift (z < 0.35), we verified that the relative continuum deficit is not an inherent feature of high-redshift quasars, albeit for a small sample. We looked into
  of luminous, unobscured quasars at z = 6 − 7 observed with JWST (Marshall et al. 2023; Loiacono et al. 2024; Bosman et al. 2024; Yue et al. 2024; Marshall et al. 2025). These high-redshift quasars instead all show positive values of log (
 , while any host galaxy contribution in these quasars should be negligible. These positive offsets could be understood by the Baldwin effect (Baldwin 1977), as they are more luminous than the objects in the Greene & Ho (2005) sample, rather than a redshift evolution. The updated reference log (
 ) value for unobscured high-redshift quasars, using these observations, is indicated in Fig. 6 with a predicted 68% scatter interval. SHELLQs broad-line quasars observed with JWST also show similar positive offsets (M. Onoue, priv. comm.). Therefore the continuum deficit relative to the BLR emission in the Chandra sources appears to be supported. The observed large EWs of broad Hα (Table 3) are in accord with this conclusion. These EWs from 557 Å to 1356 Å are larger than in low-redshift SDSS quasars that typically have EW ∼ 200 Å, and similar to values for JWST-selected AGNs (Maiolino et al. 2025). Negative values of log (
 ) and large EWs of broad Hα, as discussed above, also hold for the other five SHELLQs narrow-line objects with broad Hα detection of Matsuoka et al. (2025). If part of the BLRs is hidden, as we argued, the continuum source in our objects should be totally hidden, too, due to its inner location, and the observed continuum could be dominated by host galaxy light, apart from possible scattered light or leaked light if obscuration is patchy (related discussion can be found in Matsuoka et al. 2025).
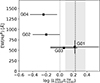 |
Fig. 6. Rest-frame EW of broad Hα in units of angstrom as a function of optical continuum deficit at 5100 Å given the broad Hα luminosity, represented by log ( |

5.2.3. X-ray quietness
Assuming the hypothesis that the BLRs in these sources are partially hidden, the observed broad Hα luminosity depends on the fraction of the BLRs directly visible and the true luminosity should be larger than the observed value. Thus we re-evaluated the broad Hα-based LX of AGNs, given our knowledge of low-redshift broad-line AGNs. With the corrected Hα luminosities, L′(Hα), the LX − L(Hα) relation (Jin et al. 2012) predicts X-ray luminosities (L′X) exceeding 1045 erg s−1 for all the Chandra targets (Table 4). We note that, as those L′(Hα) are above the luminosity range (≤1044 erg s−1 in Hα) where the LX − L(Hα) relation was derived, an extrapolation of the relation may overestimate LX, since LX/LUV decreases towards higher luminosities. With the known LX − LUV relation for quasars (e.g. Vito et al. 2019; Lusso & Risaliti 2016, see also Fig. 7), we found the possible over-estimate in LX′ to be 0.07 dex to 0.17 dex. Even taking this into account, the predicted LX are still found to be 1045 erg s−1 or larger (Table 4).
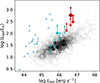 |
Fig. 7. X-ray to bolometric luminosity ratio (Lbol/LX) against Lbol. The four Chandra targets are indicated by red squares. The diamond symbol shows the result of stacking the four. Cyan crosses are those for the individual objects (diamond for stack) where Lbol was estimated from broad Hα (see Table 3). Blue triangles indicate JWST-selected AGNs from Maiolino et al. (2025), where Lbol/LX values are all lower limits, as X-ray emission was detected from none of these sources. Data for broad-line quasars (Lusso et al. 2020) are shown in a two-dimensional grey-scale histogram. |
Similar LX values are also expected from the observed [O III]λ5007 luminosity, which is considered to be a reliable indicator of isotropic AGN power (e.g. Kauffmann et al. 2003; Shen et al. 2011; Rakshit et al. 2020), especially when the BLRs are obscured as in Type 2 AGNs. With the large observed luminosities of our Chandra targets, any contribution of star formation to the narrow emission-lines should be minor; otherwise, the continuum would be much brighter than what is observed (see Sect. 5.2.2). In particular, [O III] is correlated with absorption-corrected LX. The luminosity ratio of 2−10 keV X-ray to [O III] measured for low-redshift AGNs is log (LX/L([O III]) ≈ 1.9 (Mulchaey et al. 1994; Heckman et al. 2005; Trouille & Barger 2010; Georgantopoulos & Akylas 2010; Jin et al. 2012; Stern & Laor 2012; Berney et al. 2015; Malkan et al. 2017). The scatter of this ratio from various paper ranges from 0.3 dex to 0.5 dex. These values are derived, however, with [O III] luminosities with no extinction correction. Jin et al. (2012) obtained one of the typical values, 1.88, which reduces to 1.32 when extinction correction from the mean Balmer decrement (Hα/Hβ = 5.0) for their broad-line AGN sample is applied. Using this value, our Chandra targets are expected to have LX = (1 − 2)×1045 erg s−1 (Table 4).
The agreement between the predicted LX (and hence bolometric luminosities, Lbol) by two independent estimators, L([O III]) and corrected L′(HαB), gives some credence to the assumption of partially hidden BLRs. Fig. 7 shows the bolometric to X-ray luminosity ratio, Lbol/LX (or X-ray bolometric correction), against Lbol for the Chandra targets on the diagram, similar to Fig. 2 of Maiolino et al. (2025). Two sets of data points for the Chandra targets using Lbol, estimated either from L([O III]) (red squares, Matsuoka et al. 2025, Table 7) or from broad Hα (cyan crosses)5 luminosities, are shown. For comparison, data for 2421 broad-line quasars at z = 0.01 − 7 (mostly z ≤ 3) studied by Lusso et al. (2020) are shown in the two-dimensional grey-scale histogram6 as well as the data for JWST-selected AGNs at z = 4 − 7 (Maiolino et al. 2025), all of which are lower limits, as indicated by blue triangles7. We make a cautionary note that, if the Chandra targets indeed share similar characteristics with LRDs, their bolometric luminosity estimates based on the conventional means could be highly uncertain, as has been discussed by for example Greene et al. (2025).
The luminosities of strong narrow lines are similar between the four objects: the logarithmic means and standard deviations of the luminosities of narrow Hα and [O III] in units of ergs per second are 43.59 (0.19) and 43.83 (0.10). The small dispersion of these line luminosities leads to similar predicted LX (Table 4) and Lbol (Fig. 7, Table 3). Incidentally, these values agree with the estimates in Sect. 2.2 based on the surface density with a large β ∼ 10.
The X-ray upper limits obtained from Chandra observations are nearly one order of magnitude (1.5 dex for the stack) below the expected LX argued above (see also Fig. 7). We discuss possible causes of the X-ray quietness of these objects below.
5.3. Possible explanations of X-ray quietness
The X-ray quietness of these objects could be due to either intrinsically weak X-ray emission or heavy obscuration. The former possibility is linked to a steep UV to X-ray SED in a super-Eddington accretion flow, as has been discussed for the JWST-selected AGNs (Inayoshi et al. 2025; Maiolino et al. 2025). Here we discuss the latter. The Chandra bandpass we observed (1−5 keV) corresponds to 7−35 keV in the rest frame. Suppressing this hard X-ray emission requires a significantly Compton-thick absorbing column of NH ≫ 1024 cm−2.
5.3.1. Compton-thick absorption by interstellar medium
In the hypothesis of partially hidden BLRs argued above, the X-ray source is located behind the same obscuring matter at intermediate viewing angles. Although this picture is similar to the unification scheme of Seyfert galaxies with a parsec-scale torus (Antonucci & Miller 1985), nuclear obscuration may take a different form at high redshifts, as is argued by Gilli et al. (2022). With the increased gas content in galaxies (e.g. Scoville et al. 2017), a galaxy-wide interstellar medium (ISM) is capable of making up a Compton-thick absorbing column over the bulk of solid angles. In fact, ALMA high-resolution maps of high-J transition CO lines of a quasar at z = 6 showed that warm molecular gas extends to 100-pc scales, for which a column density of NH ≃ 1025 cm−2 is inferred (Tadaki et al. 2025). Given the small host galaxy size of the order of 1 kpc (Ding et al. 2023, and in prep.; Onoue et al. 2025), this dense gas occupies a significant portion of the host galaxy. Even though the geometry is not yet clear, this form of Compton-thick gas can completely suppress X-ray emission in the Chandra targets, as well as the optical emission from inner radii.
Such extended obscuring matter has a thermal structure that is likely to deviate from that in the typical hot dust seen in low-redshift AGNs (Barvainis 1987). This may, in part, be similar to an extended dusty region, proposed to explain the lack of a near-infrared bump in the rest frame in LRDs (Li et al. 2025). Photometric observation of the rest-frame near-infrared band for these SHELLQs narrow-line objects can probe the nature of the obscuring matter.
5.3.2. Obscuration with a supercritical accretion flow
If the idea of partially hidden BLRs is discounted and only mild obscuration, as is implied from the values of extinction measured from the Balmer decrement (Table 3), is present for the optical emission region in these objects, then a distinct Compton-thick obscuration that solely affects the X-ray source is required. Various explanations have been proposed for the X-ray quietness of JWST-selected AGNs, involving optically thick gas within the dust-sublimation radius (e.g. Maiolino et al. 2025; D’Eugenio et al. 2025; Ji et al. 2025; Naidu et al. 2025; Inayoshi & Maiolino 2025). We consider here a supercritical accretion flow as one of possible mechanisms of strong X-ray attenuation using a model developed for ultra-luminous X-ray sources (ULXs, Kawashima et al. 2009; Kitaki et al. 2017; Kawanaka & Mineshige 2021; Ogawa et al. 2021, see also King 2025) when combined with an orientation effect, as is discussed below.
In the disc accretion mode, as opposed to spherical accretion, matter falls along the disc plane while radiation can escape in the polar direction, enabling a supercritical accretion flow while emitting at super-Eddington luminosity (e.g. Ohsuga et al. 2005). A number of key features of such an accretion flow are described in the slim disc prescription by Abramowicz et al. (1988). One of the relevant features in our argument is an optically thick funnel created by the innermost part of the disc, which is inflated by strong radiation pressure. It collimates the disc radiation, making it anisotropic (Ohsuga et al. 2005; Ohsuga & Mineshige 2007; Takahashi & Ohsuga 2015; Sądowski et al. 2015; Jiang et al. 2019). In AGNs, the disc radiation is in the UV range and an external mechanism is needed to produce X-rays. Kawashima et al. (2009, 2012) proposed that the radiation-pressure driven disc winds in a supercritical accretion flow can act as a Comptonising corona that produces X-rays (see also Jiang et al. 2019). The dynamical nature makes this wind-fed corona somewhat cooler and more optically thick than the conventional corona (e.g. Haardt & Maraschi 1991) above the standard thin disc in low-redshift AGNs (Kawanaka & Mineshige 2021; Inayoshi et al. 2025). In this case, the X-ray emission is also anisotropic. We refer to Kawashima et al. (2012), Kitaki et al. (2017), Ogawa et al. (2021) for details of the viewing-angle dependence of X-ray luminosity and spectral shape.
Viewing such a system face-on, the whole X-ray emitting region, including the high-temperature (108 − 109 K) part, deep down the funnel, is visible. Ultra-luminous X-ray sources (ULXs) are considered to fit in this situation (Kawashima et al. 2009; Kitaki et al. 2017; King 2024), and their AGN couterparts perhaps correspond to the most luminous, unobscured quasars. In quasars, however, disc emission moves to the UV range and the Compton-scattered emission dominates the X-ray range, unlike a stellar-mass black hole that emits X-ray disc emission. Given the cooler wind-fed corona, the X-ray spectra steepen above ∼10 keV, below which they can be as hard as low-redshift AGNs that show Γ = 1.9 − 2.0, on average (e.g. Vignali et al. 2003; Steffen et al. 2006; Just et al. 2007; Lusso & Risaliti 2016; Nanni et al. 2017; Huang et al. 2020). Since the XMM-Newton or Chandra bandpass mainly covers rest-frame energies higher than 10 keV in z ≥ 6 quasars, a single power-law fit would yield a steeper slope, as is observed in the most luminous quasars at z ∼ 6 (Γ ≃ 2.2 and Γ ∼ 2.4 respectively in Vito et al. 2019; Zappacosta et al. 2023). The fact that the spectral steepening is only found for high-redshift quasars could therefore be a combination of the rest-frame bandpass effect and a selection effect that spectral slope measurements are possible only for the most luminous quasars given the limited sensitivity. Due to the collimation, the X-ray luminosities of those most luminous quasars are likely boosted.
On the other hand, when the system is viewed at some inclined angle, the flux boosting effect disappears and the innermost part of the funnel, where hard X-rays are produced, is blocked from our direct view by the inflated inner disc which is optically thick. Any X-ray emission that is still visible is therefore much weaker and has a softer spectrum than that seen in the face-on case (Kitaki et al. 2017; Ogawa et al. 2021). Those luminous quasars at z ∼ 6, such as those in the hyperluminous quasars at the epoch of reionization (HYPERION) sample (Zappacosta et al. 2023, see also Vito et al. 2019) emit at LX ∼ 2 × 1045 erg s−1 on average. If they are the face-on version of AGNs with a supercritical accretion argued above, the same nuclei viewed at an intermediate angle would have an observed luminosity of a few times 1043 erg s−1 (for example, the rest-frame 20 keV emission when viewed at 40° would be ∼2 orders of magnitude fainter than when viewed face-on). As this expected LX fits the Chandra upper limit, the SHELLQs narrow-line objects could contain nuclei similar to the HYPERION quasars but viewed at intermediate angles. Thus the inherent anisotropy of X-ray radiation at the innermost radii of a supercritical accretion flow offers an alternative explanation of the X-ray quietness of the Chandra targets.
6. Summary
We selected obscured AGN candidates at z ∼ 6 from the SHELLQs sample for X-ray observations with Chandra, on account of thier luminous Lyα and faint UV continuum. We did not detect X-rays; this, together with the subsequent detection of weak broad Balmer emission in the rest-frame optical spectra taken with the JWST-NIRSpec, suggests that they may be luminous counterparts to JWST-selected AGNs, including LRDs, discovered at high redshifts. We interpret their weak broad Balmer emission and faint optical continua as a result of the BLRs being partly visible, while the rest of the BLRs, the optical continuum and X-ray emitting regions of the accretion disc are hidden behind an optically thick obscuring torus. Any X-ray emission can be suppressed if the obscuring matter is Compton-thick, due to the ISM of the host galaxies, as hypothesised and observed at high redshifts. Alternatively, an inflated inner accretion disc in a supercritical accretion flow could strongly suppress X-ray emission with an orientation effect.
Acknowledgments
We thank Shin Mineshige, Livia Vallini, Roberto Decarli for useful discussion, and Guido Risaliti for providing us with the data used for Fig. 7. This paper employs a list of Chandra datasets, obtained by the Chandra X-ray Observatory, contained in the Chandra Data Collection (CDC) 396 DOI: 10.25574/cdc.396 and made use of software provided by the Chandra X-ray Center (CXC). This work is based in part on observations made with the NASA/ESA/CSA James Webb Space Telescope. The data (DOI: 10.17909/cve4-9p26) were obtained from the Mikulski Archive for Space Telescopes at the Space Telescope Science Institute, which is operated by the Association of Universities for Research in Astronomy, Inc., under NASA contract NAS 5-03127 for JWST. These observations are associated with program 3417. Support for this work was provided by NASA through Chandra Award Number 23700304 issued by CXC. KIw acknowledges support under the grant PID2022-136828NB-C44 provided by MCIN/AEI/10.13039/501100011033/FEDER, UE. MO acknowledges support from Japan Society for the Promotion of Science (JSPS) KAKENHI Grant Number 24K22894. YM was supported by the Japan Society for the Promotion of Science (JSPS) KAKENHI Grant No. 21H04494. KK acknowledges the support by JSPS KAKENHI Grant Numbers 22H04939, 23K20035, and 24H00004. RG and FV acknowledge financial support by the INAF Grants for Fundamental Research 2023.
References
- Abramowicz, M. A., Czerny, B., Lasota, J. P., & Szuszkiewicz, E. 1988, ApJ, 332, 646 [Google Scholar]
- Aihara, H., Arimoto, N., Armstrong, R., et al. 2018, PASJ, 70, S4 [NASA ADS] [Google Scholar]
- Alexandroff, R., Strauss, M. A., Greene, J. E., et al. 2013, MNRAS, 435, 3306 [NASA ADS] [CrossRef] [Google Scholar]
- Antonucci, R. R. J., & Miller, J. S. 1985, ApJ, 297, 621 [NASA ADS] [CrossRef] [Google Scholar]
- Baldwin, J. A. 1977, ApJ, 214, 679 [NASA ADS] [CrossRef] [Google Scholar]
- Barvainis, R. 1987, ApJ, 320, 537 [Google Scholar]
- Berney, S., Koss, M., Trakhtenbrot, B., et al. 2015, MNRAS, 454, 3622 [CrossRef] [Google Scholar]
- Bosman, S. E. I., Álvarez-Márquez, J., Colina, L., et al. 2024, Nat. Astron., 8, 1054 [NASA ADS] [CrossRef] [Google Scholar]
- Calhau, J., Sobral, D., Santos, S., et al. 2020, MNRAS, 493, 3341 [Google Scholar]
- Davies, F. B., Hennawi, J. F., & Eilers, A.-C. 2019, ApJ, 884, L19 [Google Scholar]
- D’Eugenio, F., Maiolino, R., Perna, M., et al. 2025, MNRAS, submitted [arXiv:2503.11752] [Google Scholar]
- Ding, X., Onoue, M., Silverman, J. D., et al. 2023, Nature, 621, 51 [NASA ADS] [CrossRef] [Google Scholar]
- Elitzur, M., & Ho, L. C. 2009, ApJ, 701, L91 [Google Scholar]
- Fan, X., Strauss, M. A., Richards, G. T., et al. 2006, AJ, 131, 1203 [NASA ADS] [CrossRef] [Google Scholar]
- Ferland, G. J., Done, C., Jin, C., Landt, H., & Ward, M. J. 2020, MNRAS, 494, 5917 [Google Scholar]
- Fruscione, A., McDowell, J. C., Allen, G. E., et al. 2006, SPIE Conf. Ser., 6270, 62701V [Google Scholar]
- Furtak, L. J., Labbé, I., Zitrin, A., et al. 2024, Nature, 628, 57 [NASA ADS] [CrossRef] [Google Scholar]
- Georgantopoulos, I., & Akylas, A. 2010, A&A, 509, A38 [NASA ADS] [CrossRef] [EDP Sciences] [Google Scholar]
- Gilli, R., Norman, C., Calura, F., et al. 2022, A&A, 666, A17 [NASA ADS] [CrossRef] [EDP Sciences] [Google Scholar]
- Greene, J. E., & Ho, L. C. 2005, ApJ, 630, 122 [NASA ADS] [CrossRef] [Google Scholar]
- Greene, J. E., Labbe, I., Goulding, A. D., et al. 2024, ApJ, 964, 39 [CrossRef] [Google Scholar]
- Greene, J. E., Setton, D. J., Furtak, L. J., et al. 2025, arXiv e-prints [arXiv:2509.05434] [Google Scholar]
- Haardt, F., & Maraschi, L. 1991, ApJ, 380, L51 [Google Scholar]
- Harikane, Y., Zhang, Y., Nakajima, K., et al. 2023, ApJ, 959, 39 [NASA ADS] [CrossRef] [Google Scholar]
- Hashimoto, T., Ouchi, M., Shimasaku, K., et al. 2017, MNRAS, 465, 1543 [NASA ADS] [CrossRef] [Google Scholar]
- Heckman, T. M., Ptak, A., Hornschemeier, A., & Kauffmann, G. 2005, ApJ, 634, 161 [NASA ADS] [CrossRef] [Google Scholar]
- Hickox, R. C., & Alexander, D. M. 2018, ARA&A, 56, 625 [Google Scholar]
- HI4PI Collaboration (Ben Bekhti, et al.), 2016, A&A, 594, A116 [NASA ADS] [CrossRef] [EDP Sciences] [Google Scholar]
- Huang, J., Luo, B., Du, P., et al. 2020, ApJ, 895, 114 [NASA ADS] [CrossRef] [Google Scholar]
- Inayoshi, K., & Maiolino, R. 2025, ApJ, 980, L27 [Google Scholar]
- Inayoshi, K., Kimura, S. S., & Noda, H. 2025, PASJ, 77, 811 [Google Scholar]
- Ji, X., Maiolino, R., Übler, H., et al. 2025, MNRAS, 544, 3900 [Google Scholar]
- Jiang, L., McGreer, I. D., Fan, X., et al. 2015, AJ, 149, 188 [NASA ADS] [CrossRef] [Google Scholar]
- Jiang, Y.-F., Stone, J. M., & Davis, S. W. 2019, ApJ, 880, 67 [Google Scholar]
- Jin, C., Ward, M., & Done, C. 2012, MNRAS, 422, 3268 [Google Scholar]
- Juodžbalis, I., Maiolino, R., Baker, W. M., et al. 2024, Nature, 636, 594 [CrossRef] [Google Scholar]
- Just, D. W., Brandt, W. N., Shemmer, O., et al. 2007, ApJ, 665, 1004 [Google Scholar]
- Kang, J.-L., Done, C., Hagen, S., et al. 2025, MNRAS, 538, 121 [Google Scholar]
- Kashikawa, N., Ishizaki, Y., Willott, C. J., et al. 2015, ApJ, 798, 28 [Google Scholar]
- Kauffmann, G., Heckman, T. M., Tremonti, C., et al. 2003, MNRAS, 346, 1055 [Google Scholar]
- Kawanaka, N., & Mineshige, S. 2021, PASJ, 73, 630 [NASA ADS] [CrossRef] [Google Scholar]
- Kawashima, T., Ohsuga, K., Mineshige, S., et al. 2009, PASJ, 61, 769 [Google Scholar]
- Kawashima, T., Ohsuga, K., Mineshige, S., et al. 2012, ApJ, 752, 18 [Google Scholar]
- King, A. 2024, MNRAS, 531, 550 [NASA ADS] [CrossRef] [Google Scholar]
- King, A. 2025, MNRAS, 536, L1 [Google Scholar]
- Kitaki, T., Mineshige, S., Ohsuga, K., & Kawashima, T. 2017, PASJ, 69, 92 [Google Scholar]
- Kocevski, D. D., Finkelstein, S. L., Barro, G., et al. 2025, ApJ, 986, 126 [Google Scholar]
- Konno, A., Ouchi, M., Nakajima, K., et al. 2016, ApJ, 823, 20 [Google Scholar]
- Kraft, R. P., Burrows, D. N., & Nousek, J. A. 1991, ApJ, 374, 344 [Google Scholar]
- Krawczyk, C. M., Richards, G. T., Mehta, S. S., et al. 2013, ApJS, 206, 4 [Google Scholar]
- Li, Z., Inayoshi, K., Chen, K., Ichikawa, K., & Ho, L. C. 2025, ApJ, 980, 36 [Google Scholar]
- Liu, T., Tozzi, P., Wang, J.-X., et al. 2017, ApJS, 232, 8 [NASA ADS] [CrossRef] [Google Scholar]
- Loiacono, F., Decarli, R., Mignoli, M., et al. 2024, A&A, 685, A121 [NASA ADS] [CrossRef] [EDP Sciences] [Google Scholar]
- Lusso, E., & Risaliti, G. 2016, ApJ, 819, 154 [Google Scholar]
- Lusso, E., Hennawi, J. F., Comastri, A., et al. 2013, ApJ, 777, 86 [Google Scholar]
- Lusso, E., Risaliti, G., Nardini, E., et al. 2020, A&A, 642, A150 [NASA ADS] [CrossRef] [EDP Sciences] [Google Scholar]
- Maiolino, R., Übler, H., Perna, M., et al. 2024, A&A, 687, A67 [NASA ADS] [CrossRef] [EDP Sciences] [Google Scholar]
- Maiolino, R., Risaliti, G., Signorini, M., et al. 2025, MNRAS, 538, 1921 [Google Scholar]
- Malhotra, S., & Rhoads, J. E. 2002, ApJ, 565, L71 [NASA ADS] [CrossRef] [Google Scholar]
- Malkan, M. A., Jensen, L. D., Rodriguez, D. R., Spinoglio, L., & Rush, B. 2017, ApJ, 846, 102 [NASA ADS] [CrossRef] [Google Scholar]
- Marshall, M. A., Perna, M., Willott, C. J., et al. 2023, A&A, 678, A191 [NASA ADS] [CrossRef] [EDP Sciences] [Google Scholar]
- Marshall, M. A., Windhorst, R. A., Ferrami, G., et al. 2025, A&A, 702, A174 [NASA ADS] [CrossRef] [EDP Sciences] [Google Scholar]
- Matsuoka, Y., Onoue, M., Kashikawa, N., et al. 2016, ApJ, 828, 26 [Google Scholar]
- Matsuoka, Y., Iwasawa, K., Onoue, M., et al. 2018a, ApJS, 237, 5 [Google Scholar]
- Matsuoka, Y., Onoue, M., Kashikawa, N., et al. 2018b, PASJ, 70, S35 [Google Scholar]
- Matsuoka, Y., Strauss, M. A., Kashikawa, N., et al. 2018c, ApJ, 869, 150 [Google Scholar]
- Matsuoka, Y., Iwasawa, K., Onoue, M., et al. 2019, ApJ, 883, 183 [Google Scholar]
- Matsuoka, Y., Onoue, M., Iwasawa, K., et al. 2025, ApJ, 988, 57 [Google Scholar]
- Matthee, J., Naidu, R. P., Brammer, G., et al. 2024, ApJ, 963, 129 [NASA ADS] [CrossRef] [Google Scholar]
- Miyazaki, S., Komiyama, Y., Kawanomoto, S., et al. 2018, PASJ, 70, S1 [NASA ADS] [Google Scholar]
- Mulchaey, J. S., Koratkar, A., Ward, M. J., et al. 1994, ApJ, 436, 586 [NASA ADS] [CrossRef] [Google Scholar]
- Naidu, R. P., Matthee, J., Katz, H., et al. 2025, arXiv e-prints [arXiv:2503.16596] [Google Scholar]
- Nakajima, K., Schaerer, D., Le Fèvre, O., et al. 2018, A&A, 612, A94 [NASA ADS] [CrossRef] [EDP Sciences] [Google Scholar]
- Nanni, R., Vignali, C., Gilli, R., Moretti, A., & Brandt, W. N. 2017, A&A, 603, A128 [NASA ADS] [CrossRef] [EDP Sciences] [Google Scholar]
- Ni, Y., Di Matteo, T., Gilli, R., et al. 2020, MNRAS, 495, 2135 [NASA ADS] [CrossRef] [Google Scholar]
- Ogawa, T., Ohsuga, K., Makino, Y., & Mineshige, S. 2021, PASJ, 73, 701 [Google Scholar]
- Ohsuga, K., & Mineshige, S. 2007, ApJ, 670, 1283 [Google Scholar]
- Ohsuga, K., Mori, M., Nakamoto, T., & Mineshige, S. 2005, ApJ, 628, 368 [NASA ADS] [CrossRef] [Google Scholar]
- Onoue, M., Matsuoka, Y., Kashikawa, N., et al. 2021, ApJ, 919, 61 [Google Scholar]
- Onoue, M., Ding, X., Silverman, J. D., et al. 2025, Nat. Astron., 9, 1541 [Google Scholar]
- Osterbrock, D. E. 1962, ApJ, 135, 195 [NASA ADS] [CrossRef] [Google Scholar]
- Osterbrock, D. E. 1977, ApJ, 215, 733 [Google Scholar]
- Rakshit, S., Stalin, C. S., & Kotilainen, J. 2020, ApJS, 249, 17 [Google Scholar]
- Sądowski, A., Narayan, R., Tchekhovskoy, A., et al. 2015, MNRAS, 447, 49 [CrossRef] [Google Scholar]
- Schindler, J.-T., Hennawi, J. F., Davies, F. B., et al. 2025, Nat. Astron., 9, 1732 [Google Scholar]
- Scoville, N., Lee, N., Vanden Bout, P., et al. 2017, ApJ, 837, 150 [Google Scholar]
- Shen, Y., Richards, G. T., Strauss, M. A., et al. 2011, ApJS, 194, 45 [Google Scholar]
- Shibuya, T., Ouchi, M., Harikane, Y., et al. 2018, PASJ, 70, S15 [Google Scholar]
- Sobral, D., Matthee, J., Darvish, B., et al. 2018, MNRAS, 477, 2817 [Google Scholar]
- Steffen, A. T., Strateva, I., Brandt, W. N., et al. 2006, AJ, 131, 2826 [Google Scholar]
- Stern, J., & Laor, A. 2012, MNRAS, 426, 2703 [NASA ADS] [CrossRef] [Google Scholar]
- Tadaki, K., Esposito, F., Vallini, L., et al. 2025, Nat. Astron., 9, 720 [Google Scholar]
- Takahashi, H. R., & Ohsuga, K. 2015, PASJ, 67, 60 [NASA ADS] [CrossRef] [Google Scholar]
- Trebitsch, M., Volonteri, M., & Dubois, Y. 2019, MNRAS, 487, 819 [CrossRef] [Google Scholar]
- Trouille, L., & Barger, A. J. 2010, ApJ, 722, 212 [Google Scholar]
- Übler, H., Maiolino, R., Curtis-Lake, E., et al. 2023, A&A, 677, A145 [NASA ADS] [CrossRef] [EDP Sciences] [Google Scholar]
- Vignali, C., Brandt, W. N., & Schneider, D. P. 2003, AJ, 125, 433 [Google Scholar]
- Vito, F., Brandt, W. N., Yang, G., et al. 2018, MNRAS, 473, 2378 [Google Scholar]
- Vito, F., Brandt, W. N., Bauer, F. E., et al. 2019, A&A, 630, A118 [NASA ADS] [CrossRef] [EDP Sciences] [Google Scholar]
- Wang, B., Leja, J., de Graaff, A., et al. 2024, ApJ, 969, L13 [NASA ADS] [CrossRef] [Google Scholar]
- Weisskopf, M. C., Wu, K., Trimble, V., et al. 2007, ApJ, 657, 1026 [Google Scholar]
- Willott, C. J., Delfosse, X., Forveille, T., Delorme, P., & Gwyn, S. D. J. 2005, ApJ, 633, 630 [NASA ADS] [CrossRef] [Google Scholar]
- Willott, C. J., Delorme, P., Reylé, C., et al. 2009, AJ, 137, 3541 [Google Scholar]
- Winkler, H. 1992, MNRAS, 257, 677 [NASA ADS] [Google Scholar]
- Wu, X.-B., Wang, F., Fan, X., et al. 2015, Nature, 518, 512 [Google Scholar]
- Yue, M., Eilers, A.-C., Simcoe, R. A., et al. 2024, ApJ, 966, 176 [NASA ADS] [CrossRef] [Google Scholar]
- Zappacosta, L., Piconcelli, E., Fiore, F., et al. 2023, A&A, 678, A201 [NASA ADS] [CrossRef] [EDP Sciences] [Google Scholar]
If these five points are excluded, we find a steeper correlation between M1450 and log L(Lyα), and a scatter reduced by 30%.
Extended sources are also selected as high-redshift quasar cadidates, but they are given lower priority for spectroscopic follow-up.
Jin et al. (2012) modelled Balmer lines with three components. As their narrow component matches the profile of [O III], it corresponds to our narrow component, as defined in Matsuoka et al. (2025).
We note that the luminosity of broad Hα used here is the observed one (Table 3), not L′(Hα) discussed above.
First, AGN continuum luminosity at 5100 Å,  , was estimated, using the empirical relation (Greene & Ho 2005) with extinction-corrected broad Hα luminosity, and then converted to Lbol with the bolometric correction of 7.79 (Krawczyk et al. 2013).
Lbol was derived from monochromatic luminosity at 2500 Å given in Lusso et al. (2020) with the bolometric correction of 2.75 (Krawczyk et al. 2013) while LX was derived from the 2 keV luminosity assuming Γ = 2 as the spectral slope in the 2−10 keV band.
Lbol of the JWST-selected AGN were based on broad Hα but have been adjusted by using the same bolometric correction as used for the Chandra sources. LX values have also been adjusted by matching the same assumed spectral slope of Γ = 2, as used for our Chandra sources and the broad-line quasars (Γ = 1.7 was assumed in Maiolino et al. 2025).
All Tables
All Figures
|
Fig. 1. Line widths (FWHM) and rest-frame EWs of Lyα of SHELLQs quasars. Left panel: CDF of FWHM(Lyα) in units of kilometres per second. Seven objects show unresolved lines that have an upper limit on FWHM of 230 km s−1. The dotted line indicates the dividing line at 500 km s−1 below which narrow-line objects are defined. Right panel: CDF of EW(Lyα). The dotted line indicates 250 Å, above which five outliers in Fig. 2, including the four Chandra targets, are found. |
| In the text | |
|
Fig. 2. UV absolute magnitude, M1450, as a function of Lyα luminosity of SHELLQs quasars. Broad-line (FWHM(Lyα) ≥ 500 km s−1) and narrow-line (FWHM(Lyα) < 500 km s−1) objects are plotted with blue circles and red squares, respectively. The four Chandra targets are circled in red. The dashed line indicates the best linear fit to both broad- and narrow-line objects. The two dotted lines show the 95% compatible intervals. Data for LAEs at z ∼ 6 detected in the Subaru HSC survey from Shibuya et al. (2018) are also plotted in grey for comparison. Crosses are LAEs for which UV continuum emission was detected, while triangles are those for which only upper limits of UV emission were obtained. |
| In the text | |
|
Fig. 3. Mean Lyα profile of the four Chandra targets. |
| In the text | |
|
Fig. 4. Chandra 1−5 keV images of the four narrow-line SHELLQs quasars. Each panel is a 15″ × 15″ field of view centred on the target. The image orientation is north up, east to the left. The circle indicates the optical position with a 1 arcsec radius. |
| In the text | |
|
Fig. 5. Upper limit of intrinsic LX corresponding to three counts (the 95% upper limit obtained from a 60 ks exposure) for a different assumed spectral slope, Γ. LX is the unabsorbed, rest-frame 2−10 keV luminosity. Examples for three values of photon index, Γ = 1.6 (dotted line), 2.0 (dashed line), or 2.4 (dash-dotted line), as a function of NH are shown. |
| In the text | |
|
Fig. 6. Rest-frame EW of broad Hα in units of angstrom as a function of optical continuum deficit at 5100 Å given the broad Hα luminosity, represented by log ( |
| In the text | |
|
Fig. 7. X-ray to bolometric luminosity ratio (Lbol/LX) against Lbol. The four Chandra targets are indicated by red squares. The diamond symbol shows the result of stacking the four. Cyan crosses are those for the individual objects (diamond for stack) where Lbol was estimated from broad Hα (see Table 3). Blue triangles indicate JWST-selected AGNs from Maiolino et al. (2025), where Lbol/LX values are all lower limits, as X-ray emission was detected from none of these sources. Data for broad-line quasars (Lusso et al. 2020) are shown in a two-dimensional grey-scale histogram. |
| In the text | |
Current usage metrics show cumulative count of Article Views (full-text article views including HTML views, PDF and ePub downloads, according to the available data) and Abstracts Views on Vision4Press platform.
Data correspond to usage on the plateform after 2015. The current usage metrics is available 48-96 hours after online publication and is updated daily on week days.
Initial download of the metrics may take a while.