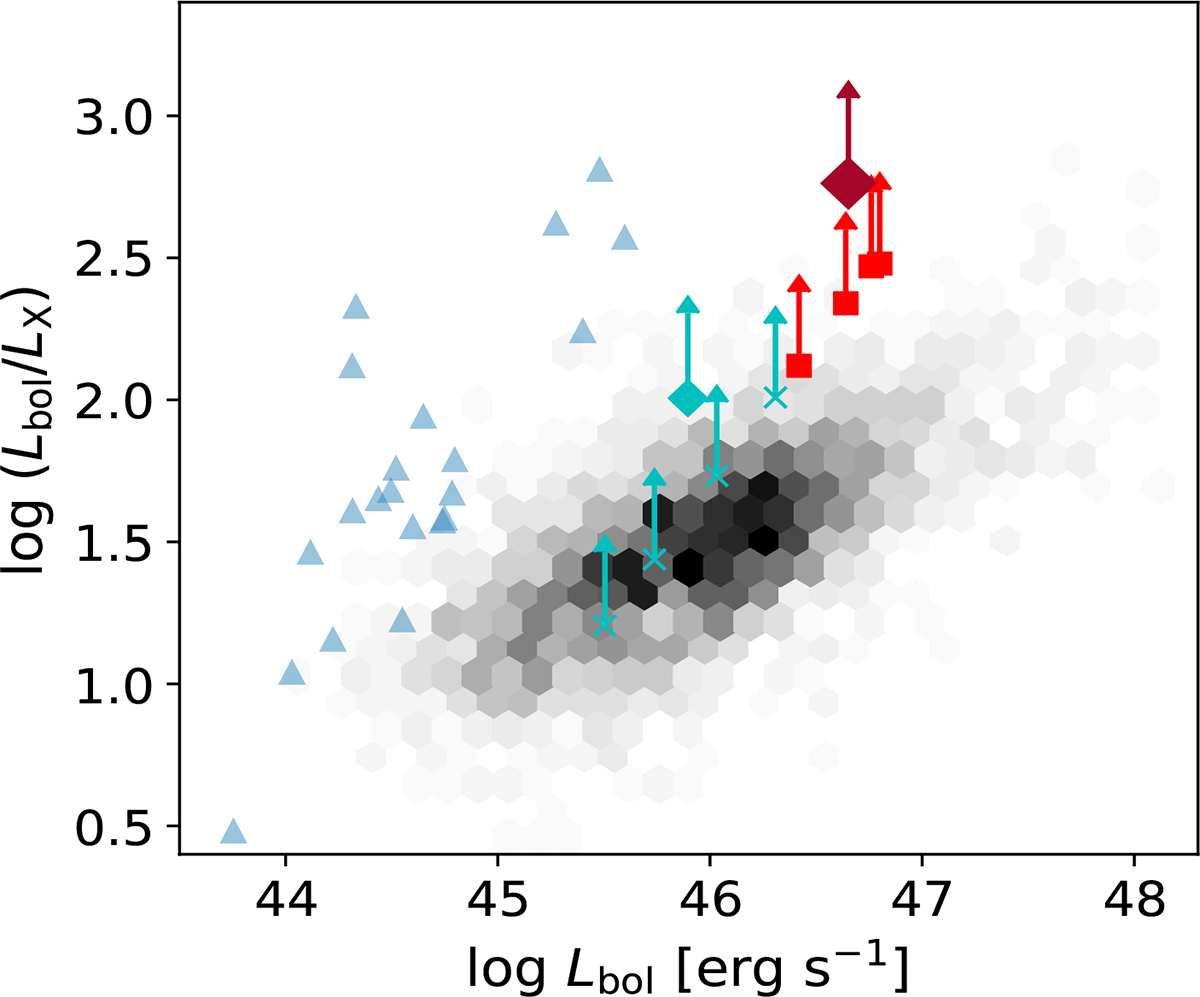
Fig. 7.
Download original image
X-ray to bolometric luminosity ratio (Lbol/LX) against Lbol. The four Chandra targets are indicated by red squares. The diamond symbol shows the result of stacking the four. Cyan crosses are those for the individual objects (diamond for stack) where Lbol was estimated from broad Hα (see Table 3). Blue triangles indicate JWST-selected AGNs from Maiolino et al. (2025), where Lbol/LX values are all lower limits, as X-ray emission was detected from none of these sources. Data for broad-line quasars (Lusso et al. 2020) are shown in a two-dimensional grey-scale histogram.
Current usage metrics show cumulative count of Article Views (full-text article views including HTML views, PDF and ePub downloads, according to the available data) and Abstracts Views on Vision4Press platform.
Data correspond to usage on the plateform after 2015. The current usage metrics is available 48-96 hours after online publication and is updated daily on week days.
Initial download of the metrics may take a while.