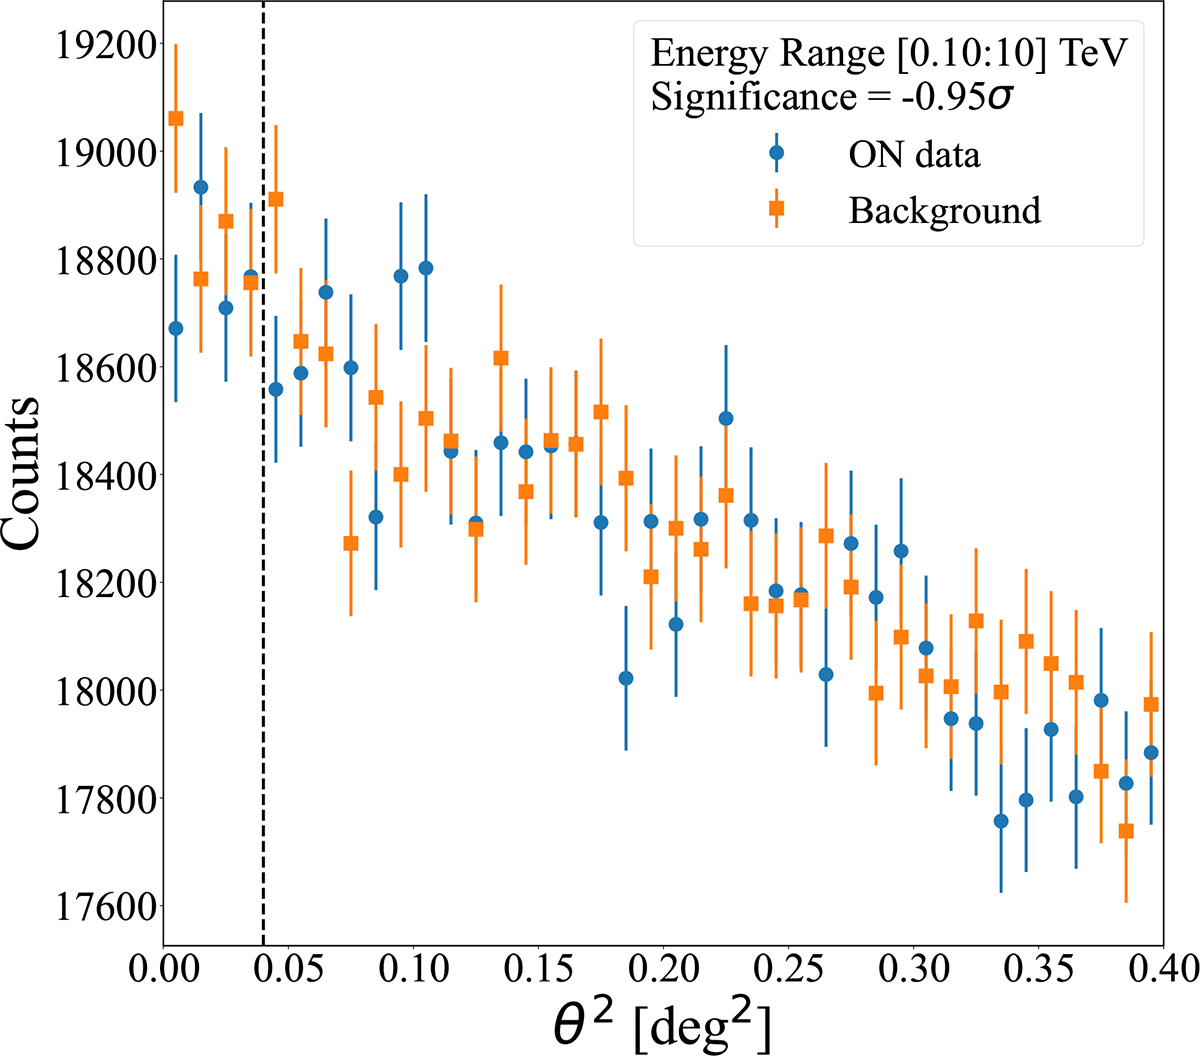
Fig. 1.
Download original image
θ2 plot on SGR 1935+2154 persistent emission. We used 25.5 h of high-quality data (see Sect. 3), which we show here in a single energy bin from 0.1 TeV to 10 TeV. We show the distribution of ON counts in blue and the background distribution in orange. The dashed line represents the θ2 cut used to evaluate the significance. No emission is detected.
Current usage metrics show cumulative count of Article Views (full-text article views including HTML views, PDF and ePub downloads, according to the available data) and Abstracts Views on Vision4Press platform.
Data correspond to usage on the plateform after 2015. The current usage metrics is available 48-96 hours after online publication and is updated daily on week days.
Initial download of the metrics may take a while.