Open Access
Fig. 3.
Download original image
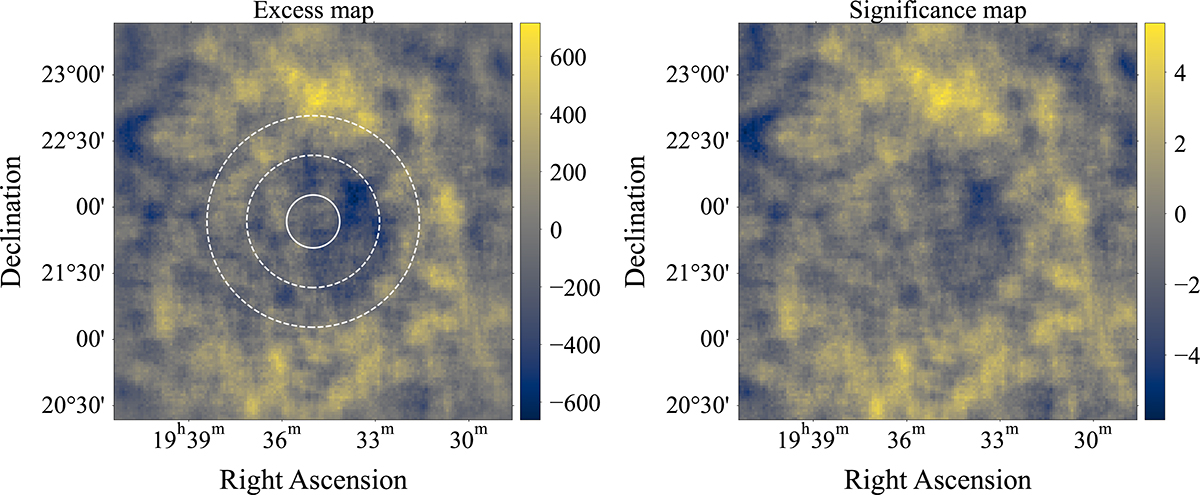
Excess (left) and statistical significance (right) maps in a 3 deg × 3 deg region centred on SGR 1935+2154 in the 0.1 TeV to 10 TeV energy range. The ON region is shown as a white circle, while the background ring is delimited by the two dashed circles. The maps do not show any significant excess on the source.
Current usage metrics show cumulative count of Article Views (full-text article views including HTML views, PDF and ePub downloads, according to the available data) and Abstracts Views on Vision4Press platform.
Data correspond to usage on the plateform after 2015. The current usage metrics is available 48-96 hours after online publication and is updated daily on week days.
Initial download of the metrics may take a while.