Fig. 1
Download original image
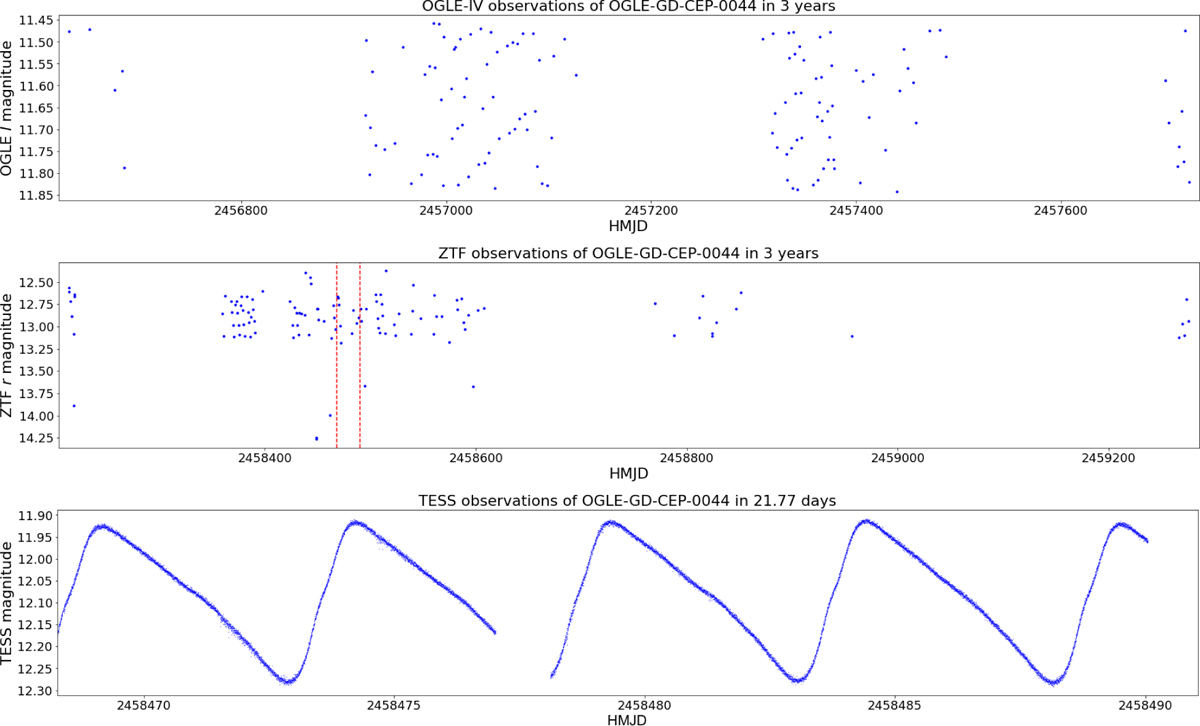
Visualization of the difference between sparse and dense sampling of photometric light curves. We chose a classical Cepheid for this comparison. OGLE-GD-CEP-0044 is a relatively bright Cepheid with a period of 5.09 days. The upper graph shows OGLE-IV data for a 3-year-long observation window that has 130 data points. The middle graph shows observational data from the ZTF survey, also in a 3-year-long observational window with 119 data points. The third graph shows a 21.77-day-long observation from the TESS mission. The light curve contains 14 898 measurements. The time span covered by the TESS observations is presented in the middle graph by two vertical dashed lines.
Current usage metrics show cumulative count of Article Views (full-text article views including HTML views, PDF and ePub downloads, according to the available data) and Abstracts Views on Vision4Press platform.
Data correspond to usage on the plateform after 2015. The current usage metrics is available 48-96 hours after online publication and is updated daily on week days.
Initial download of the metrics may take a while.