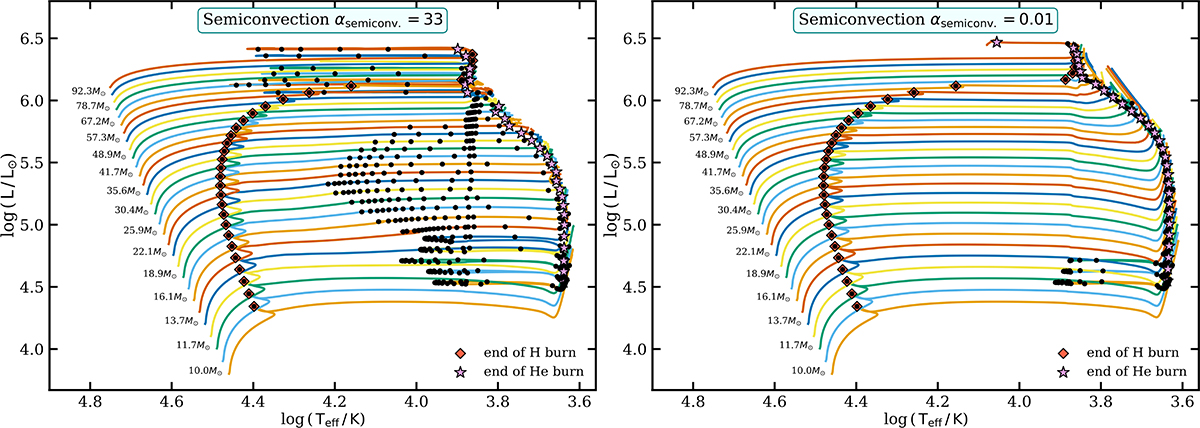
Fig. D.3.
Download original image
Hertzsprung-Russell diagram with single stellar tracks that were used as a basis for the computation of critical mass ratios, minimum orbital separations from SMT evolution, and the corresponding minimum BBH merger delay times (see results for stellar models with semiconvection αsemiconv. = 33 in Fig. 5 and with αsemiconv. = 0.01 in the right panel of Fig. 6). Here there tracks are of 30 different masses, logarithmically spaced from 10 to 100 M⊙, evolved until at least the end of core-He burning. Black dots are equally spaced every 50,000 years during the post-MS evolution.
Current usage metrics show cumulative count of Article Views (full-text article views including HTML views, PDF and ePub downloads, according to the available data) and Abstracts Views on Vision4Press platform.
Data correspond to usage on the plateform after 2015. The current usage metrics is available 48-96 hours after online publication and is updated daily on week days.
Initial download of the metrics may take a while.