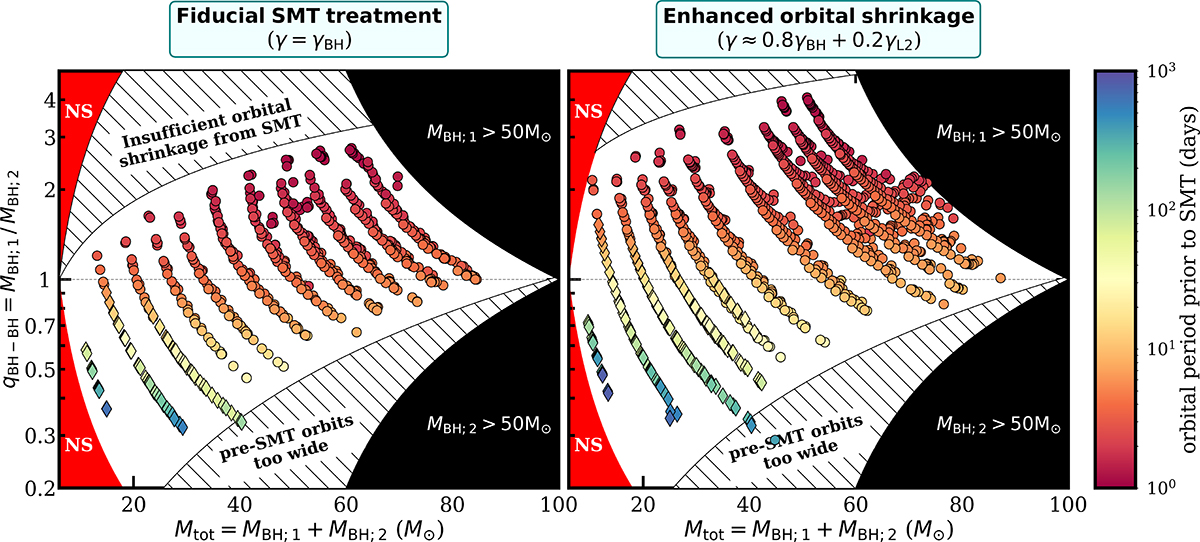
Fig. 8.
Download original image
Mass ratios of BBH mergers from SMT evolution are confined to the range from ∼0.3 to ∼3, determined by the physics of stable binary interactions. We plot the BBH mass ratios qBH − BH as a function of the BBH mass from our binary MESA grids, where qBH − BH is defined as MBH; 1/MBH; 2 and with MBH; 1 (MBH; 2) as the mass of the first (second) born BH. Hatched regions indicate the combinations of BBH masses and mass ratios that cannot be produced via SMT evolution (see text). This results in a positive trend between qBH − BH and Mtot. Circles indicate models in which the SMT interaction was initiated by a MS donor (case A) and diamonds mark SMT evolution from a post-MS donor (case B or C). The color indicates the orbital period at the BH+O-star stage (i.e., before the SMT). Based on binary grids of BH+O-star systems with MBH; 1 = 4, 7, 10, 13, 16, 20, 24, 28, 32, 36 M⊙, and 40 M⊙.
Current usage metrics show cumulative count of Article Views (full-text article views including HTML views, PDF and ePub downloads, according to the available data) and Abstracts Views on Vision4Press platform.
Data correspond to usage on the plateform after 2015. The current usage metrics is available 48-96 hours after online publication and is updated daily on week days.
Initial download of the metrics may take a while.