Fig. 1
Download original image
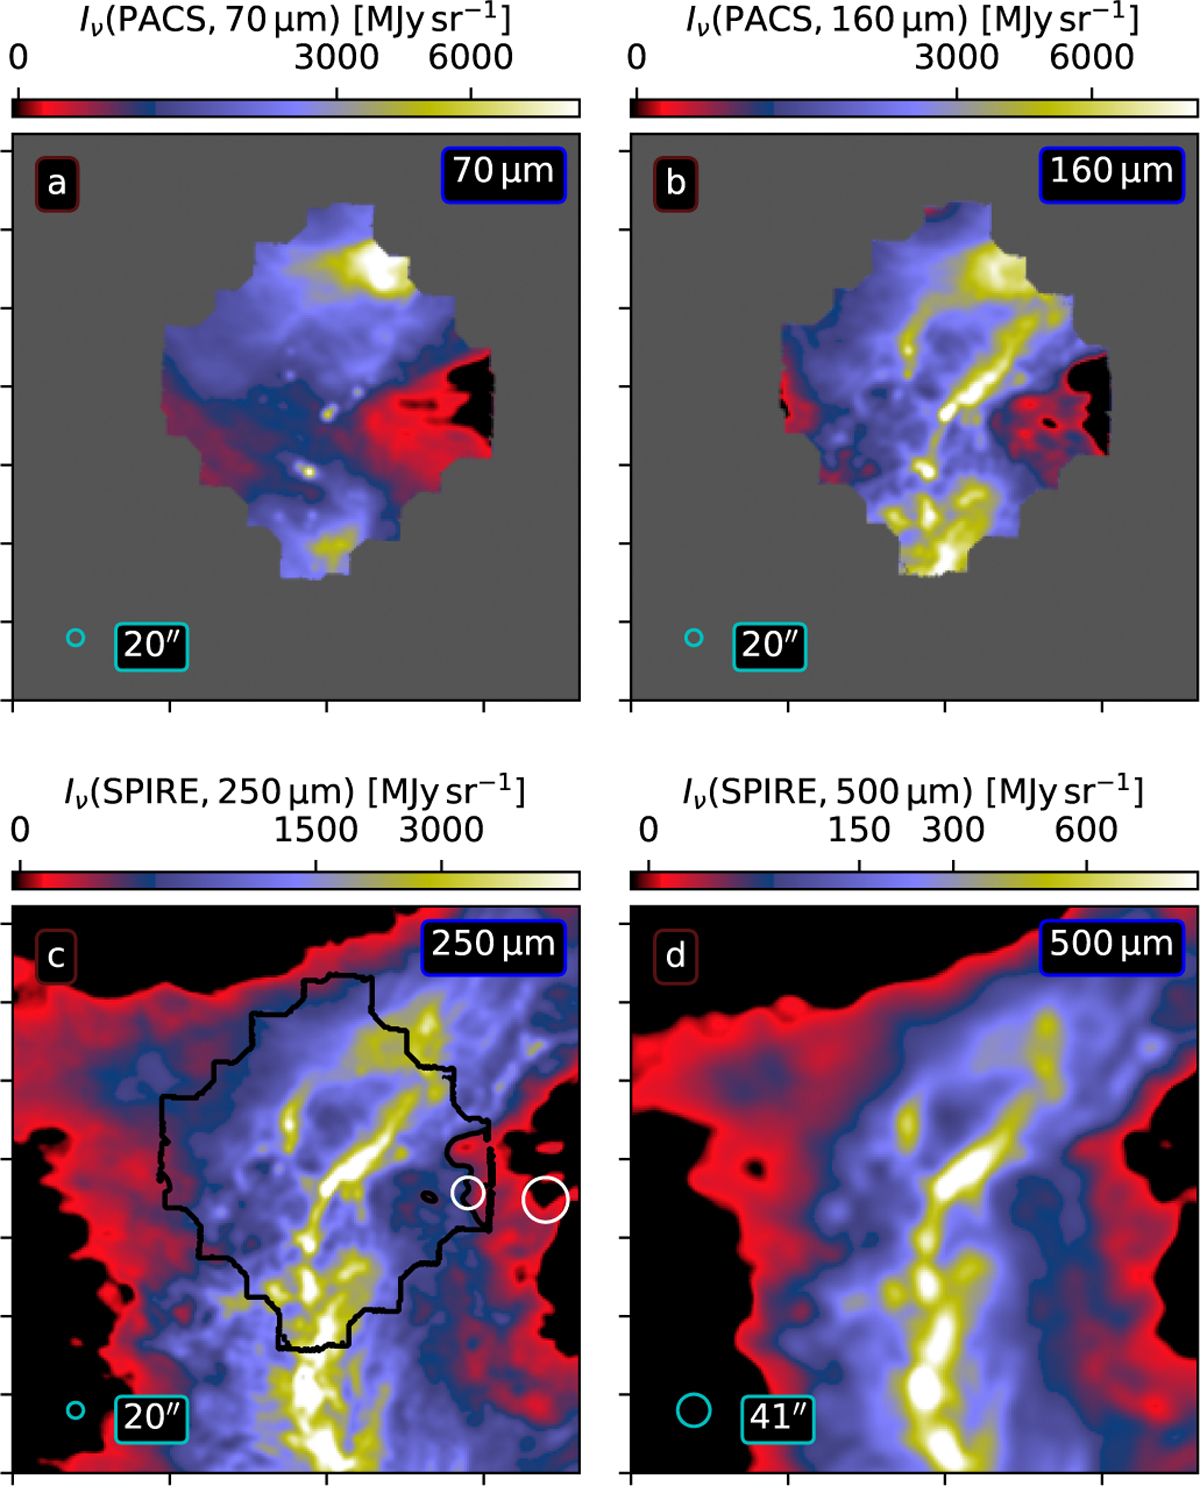
Examples of OMC-3 observations. The maps show background-subtracted surface brightness values (non-linear colour scale) smoothed to the resolution used in the model fits. The plotted area is identical to previous figures. Frame c shows the outline of the PACS coverage and the reference areas for the SPIRE background subtraction (larger white circle) and for the adjustment of the PACS zero level (smaller white circle).
Current usage metrics show cumulative count of Article Views (full-text article views including HTML views, PDF and ePub downloads, according to the available data) and Abstracts Views on Vision4Press platform.
Data correspond to usage on the plateform after 2015. The current usage metrics is available 48-96 hours after online publication and is updated daily on week days.
Initial download of the metrics may take a while.