Fig. 11
Download original image
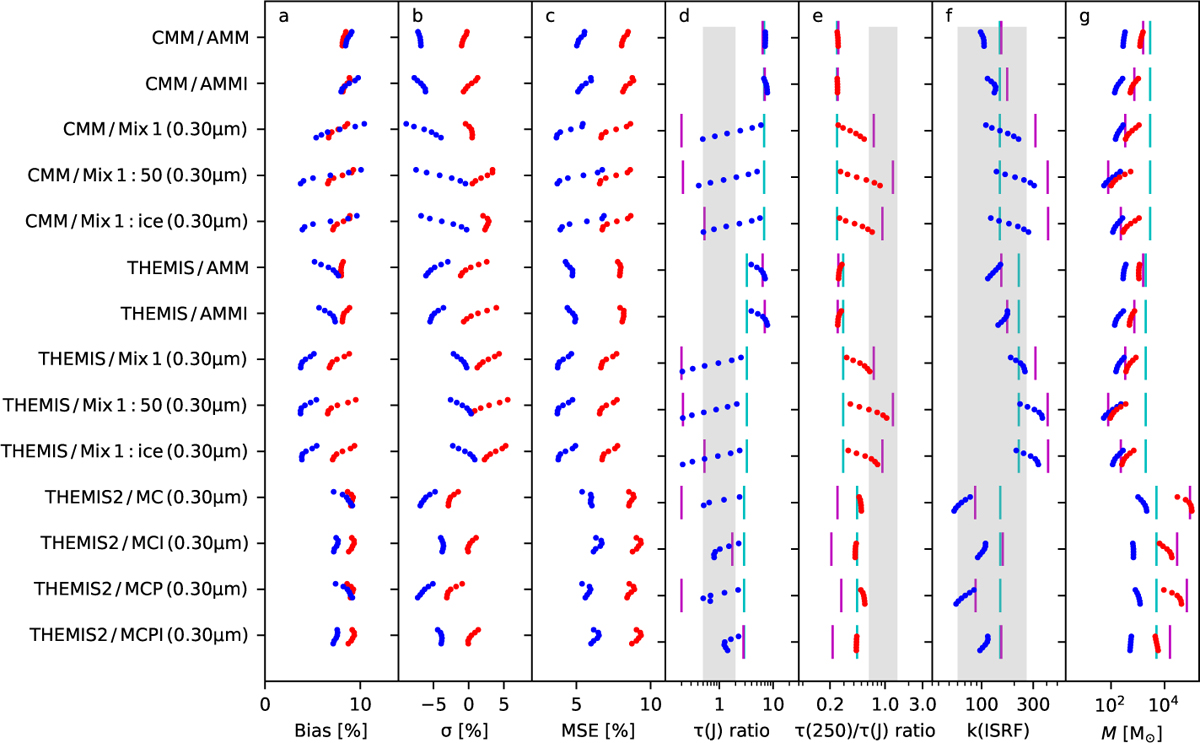
As Fig. 10, but for models with two dust components with density-dependent abundances. Results are shown for the cloud model C with ![]() and density thresholds n0= 103−3.2 × 104 cm−3, with symbols for higher n0 values shifted to slightly higher y-axis positions. In frame d, τ(J) is calculated using the actual dust models and the spatially varying extinction curves. The vertical lines in frames d-e indicate the corresponding single-dust results from Fig. 10 for the first (cyan lines) and the second (magenta lines) of the dust components.
and density thresholds n0= 103−3.2 × 104 cm−3, with symbols for higher n0 values shifted to slightly higher y-axis positions. In frame d, τ(J) is calculated using the actual dust models and the spatially varying extinction curves. The vertical lines in frames d-e indicate the corresponding single-dust results from Fig. 10 for the first (cyan lines) and the second (magenta lines) of the dust components.
Current usage metrics show cumulative count of Article Views (full-text article views including HTML views, PDF and ePub downloads, according to the available data) and Abstracts Views on Vision4Press platform.
Data correspond to usage on the plateform after 2015. The current usage metrics is available 48-96 hours after online publication and is updated daily on week days.
Initial download of the metrics may take a while.